GA4 Explorations Guide: 4 Reports Ecommerce Stores Use Most

How Explorations differ from standard reports, the seven techniques, how to set up the four that matter most for ecommerce, and the retention, sampling and sharing rules that trip people up.
Some questions are hard to answer in GA4’s standard reports: where exactly do shoppers drop off, and what do buyers look at before they buy? That’s what Explorations are for.
Explorations offer seven techniques and a lot of settings, so it’s not obvious where to start. This article narrows it down to the four types an online store uses most, what each one tells you and how to set it up, plus what to check when exploration numbers don’t match your other reports. Screens and specs are as of October 2026.
What are GA4 Explorations?
Explorations are where you choose your own dimensions, metrics and segments to analyze data in ways the standard reports don’t. Click Explore in GA4’s left navigation to open the Explorations page, where you create new explorations and open the ones you’ve saved.
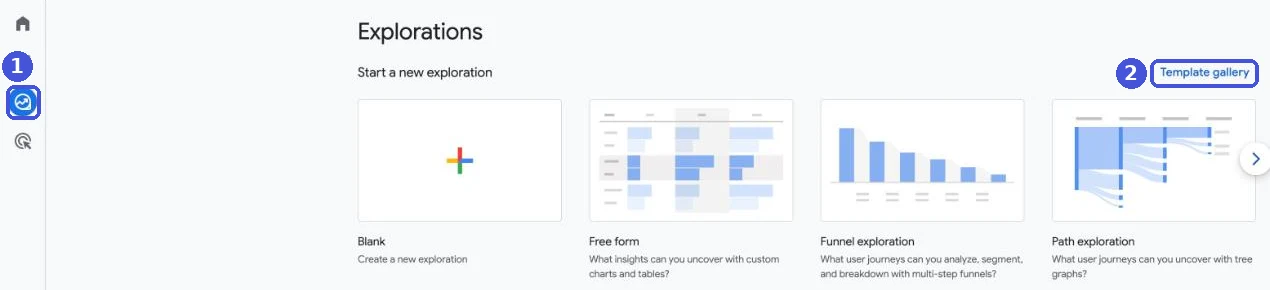
Here’s how they compare with standard reports:
| Standard reports | Explorations | |
|---|---|---|
| Purpose | Fixed views everyone reads the same way | Digging into a question with your own breakdowns |
| Setup | None (built in) | You build them |
| Who can see them | Everyone with access to the property | Only the creator; shared explorations are view-only for others |
| Date range | Not limited by data retention | Only within the data retention period |
| Sampling | Not applied | Can apply when a query covers many events |
A simple split: check your weekly numbers in standard reports, and when something there makes you ask “why?”, dig into it with an exploration.
The seven exploration techniques
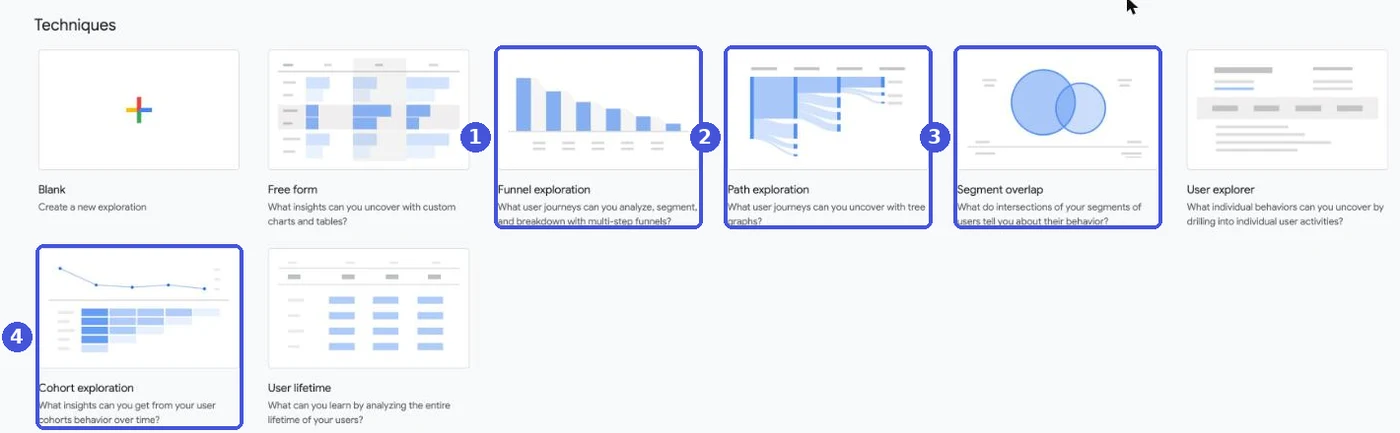
Explorations offer seven techniques. The names below are how they appear in GA4; Google’s help also calls user explorer “user exploration” in places.
| Technique | What it shows |
|---|---|
| Free form | Tables and charts combining any dimensions and metrics |
| Funnel exploration | Where, and how many, users drop off across steps you define |
| Path exploration | Which pages or events users moved to before or after a given point |
| Segment overlap | How two or three segments overlap |
| Cohort exploration | Whether users who started in the same period came back later |
| User explorer | The activity of an individual user |
| User lifetime | Totals, such as revenue, across a user’s lifetime since their first visit |
Of these, the four that tie most directly to revenue for an online store are funnel exploration, path exploration, segment overlap and cohort exploration.
The four explorations ecommerce stores use most
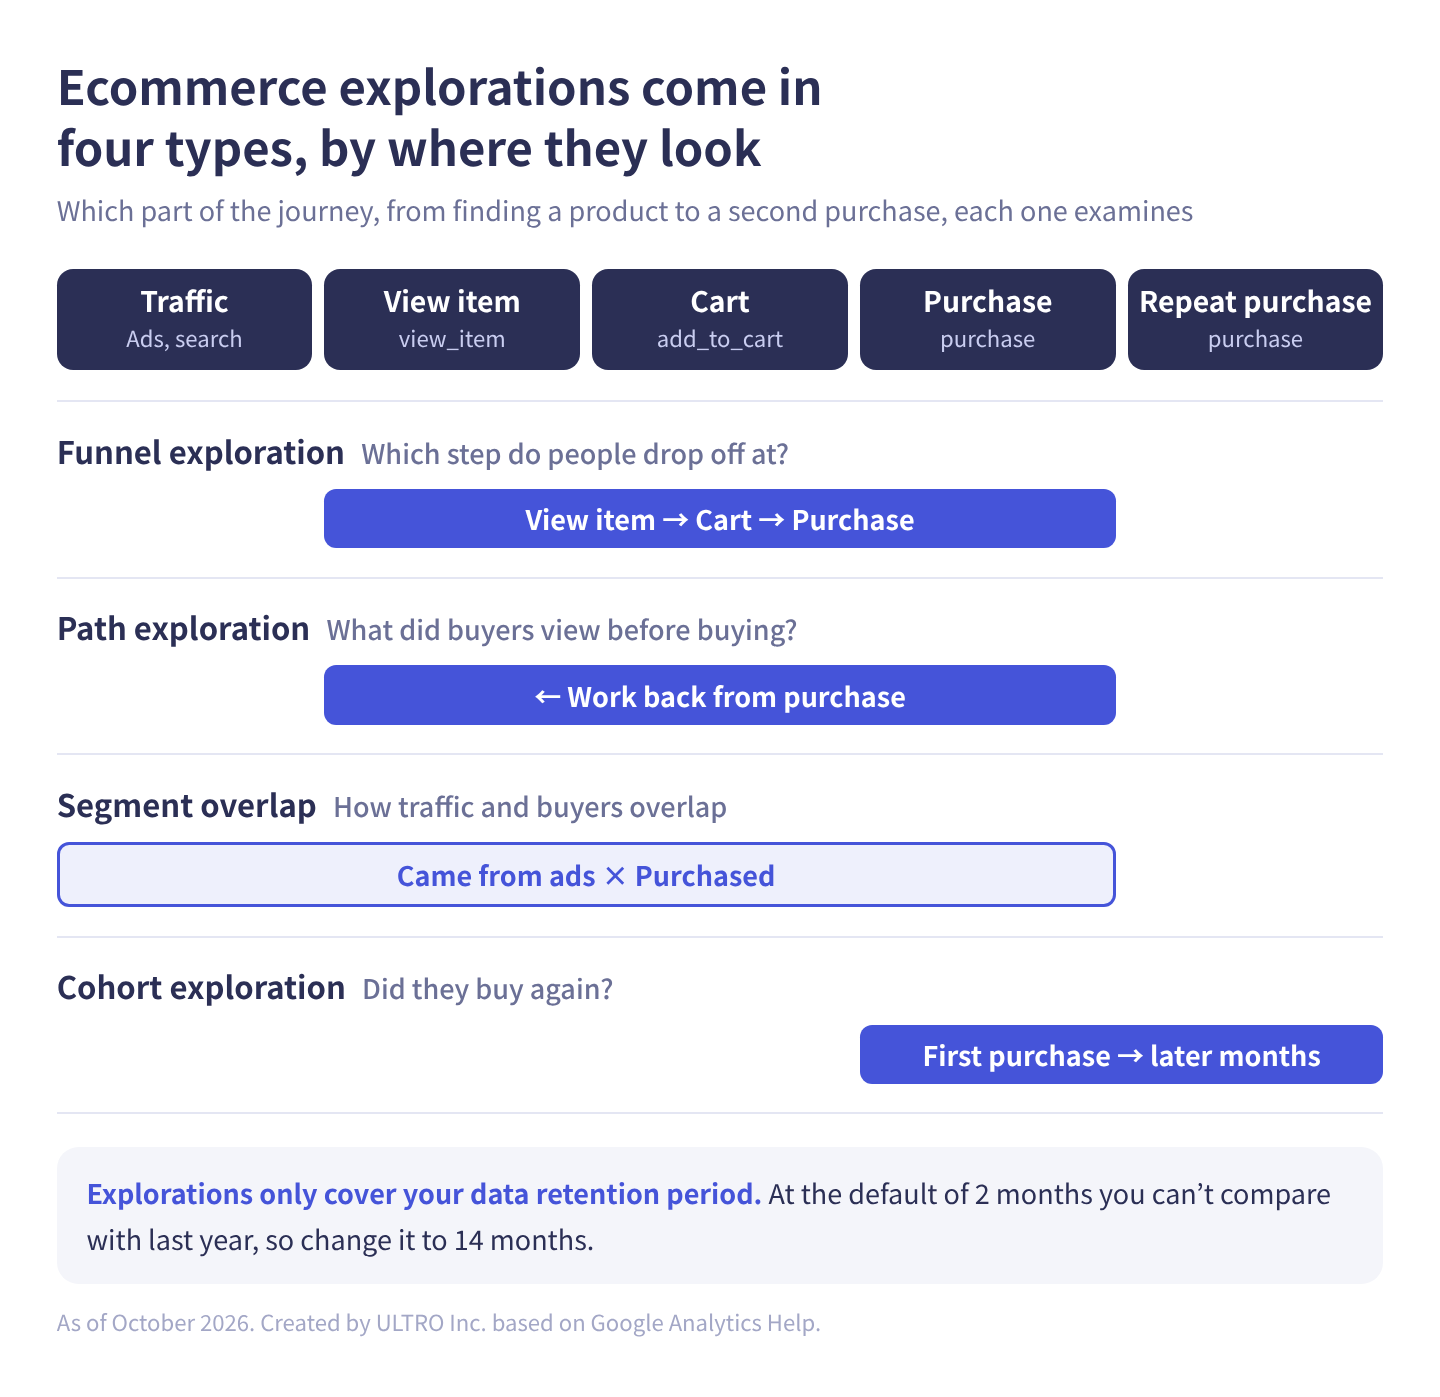
Which of the four you use depends on which part of the journey you want to look at, from finding a product to buying a second time. Here’s the overview.
As a table:
| Technique | Where it looks | Question it answers |
|---|---|---|
| Funnel exploration | From product view to purchase | Which step are shoppers dropping off at? |
| Path exploration | Just before purchase | What do buyers look at before they buy? |
| Segment overlap | Traffic and purchases | How much do ad visitors and buyers overlap? |
| Cohort exploration | After the first purchase | Do first-time buyers buy again? |
If your Shopify store is connected to GA4 through the Google & YouTube app, GA4 is already receiving view_item, add_to_cart, begin_checkout and purchase events. The setups below assume those events are there. If you’re not sure, see Shopify Google Analytics Setup.
Funnel exploration: find where shoppers drop off
A funnel exploration shows, step by step, what percentage of people who viewed a product added it to the cart, started checkout and bought.
To set it up:
- On the Explorations page, choose Funnel exploration.
- In the Settings column, click the pencil icon next to Steps and set step 1 to view_item, step 2 to add_to_cart, step 3 to begin_checkout and step 4 to purchase.
- Drag Device category into Breakdown to compare mobile with desktop.
You can define up to 10 steps. Turn on Show elapsed time to see the average time between steps.
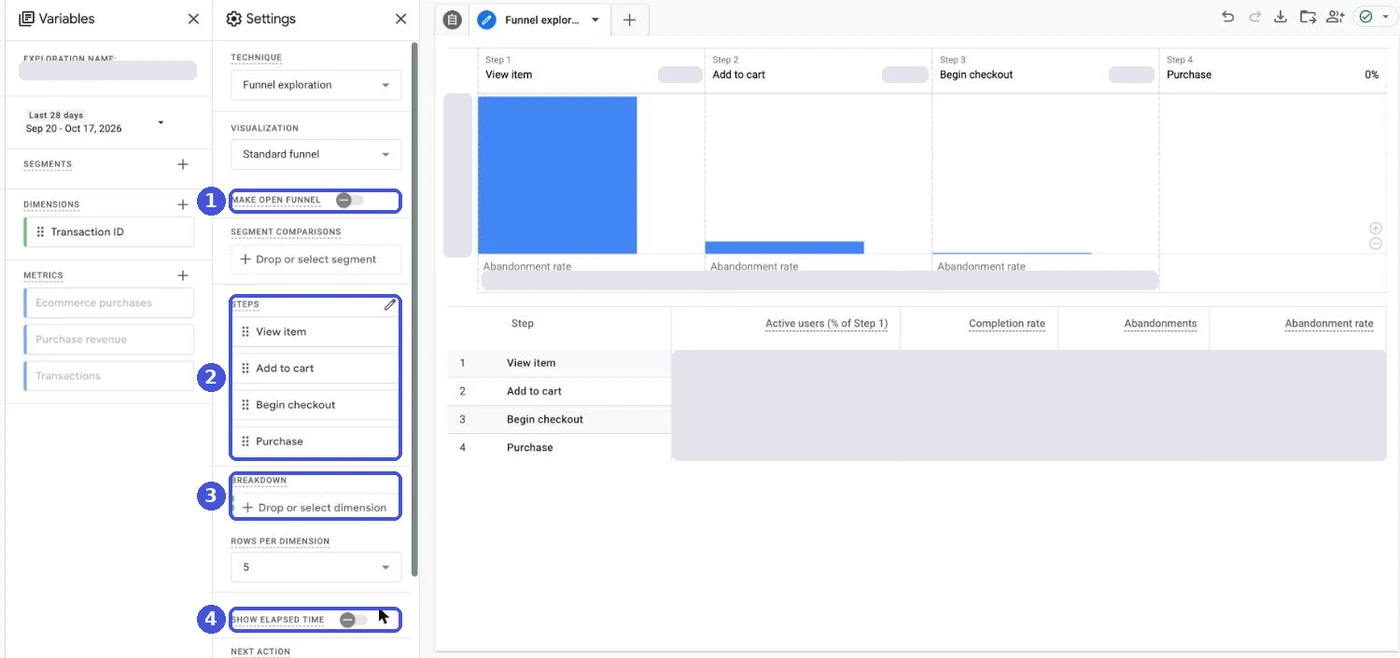
The setting to watch is open versus closed. With Make open funnel off (a closed funnel), users are only counted if they entered at step 1. Turn it on and users can enter at any step. Some shoppers add to cart without viewing the product page in that session, for example from a wishlist, so use a closed funnel to follow the flow from product pages, and an open funnel to see how many people reach checkout from anywhere.
The step that loses the most people is where to focus your fixes.
Path exploration: work back from purchase
A path exploration shows where users went from a given point, branching out like a tree. The most useful version for a store is to set purchase as the ending point and work backward to see what buyers looked at first.
- On the Explorations page, choose Path exploration.
- Click Start over at the top right.
- Click Ending point, choose Event name as the node type, and pick purchase from the list.
- Change the node type for the previous steps to Page title and screen name or Page path and screen class to see which pages buyers viewed.
Each step shows the top 5 nodes by default, and you can add up to 20 with + More. Anything beyond that is grouped into Others. You can set a starting point or an ending point, but not both.
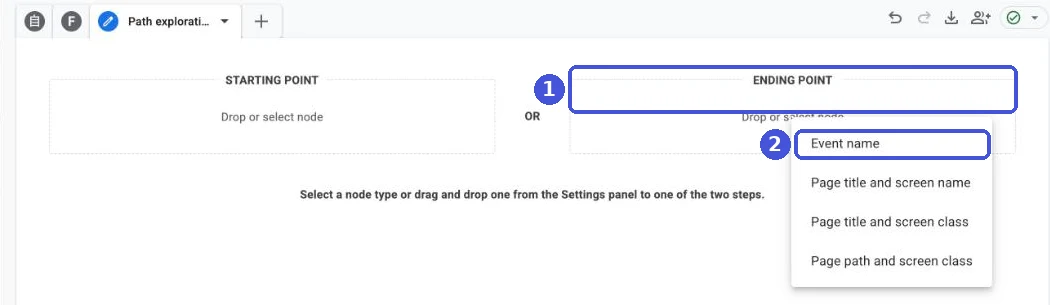
If review pages, a size chart or the shipping page keep showing up right before purchase, that’s information buyers use to decide. Putting it on the product page saves them the round trip.
Segment overlap: see how traffic and buyers overlap
Segment overlap lets you pick two or three segments and see how they overlap in a Venn diagram.
For example, overlap “users who came from Meta ads,” “mobile users” and “users who purchased” to see which device ad visitors who went on to buy were using.
There are three kinds of segments: user, session and event. Use a user segment when the condition is “this person did X at some point,” such as purchasers, and a session segment when it’s “they did X during that visit.” Right-click an overlapping area to create a segment from just that part. You can also build an audience for ads from a segment, but Google’s help points out that segments and audiences are separate features and can show different user counts for the same conditions.
Cohort exploration: see whether buyers come back
A cohort exploration lines up users who started in the same period and shows, week by week or month by month, whether they came back. For a store, the useful version groups customers by the month of their first purchase within the date range and shows whether they bought again in later months.
- On the Explorations page, choose Cohort exploration from the Template gallery.
- Set Cohort inclusion to Any transaction.
- Set Return criteria to Any transaction as well.
- Set Cohort granularity to Monthly.
Each row is the month of the first purchase, each column is the number of months after it, and each cell is how many of those customers bought in that month. A customer who bought before the date range is counted as new. Keep in mind that this only counts people GA4 could track, and someone who switches browser or device is counted as a different user. For an accurate repeat purchase rate, calculate it from your Shopify order data instead.
When exploration numbers don’t match
If purchases in GA4 come in below your Shopify orders, the cause may not be your exploration setup at all, but purchases that never reached GA4. Export the Transaction ID dimension from an exploration and match it against your Shopify orders to find the missing ones (check first whether the ID holds the order number or the order ID).
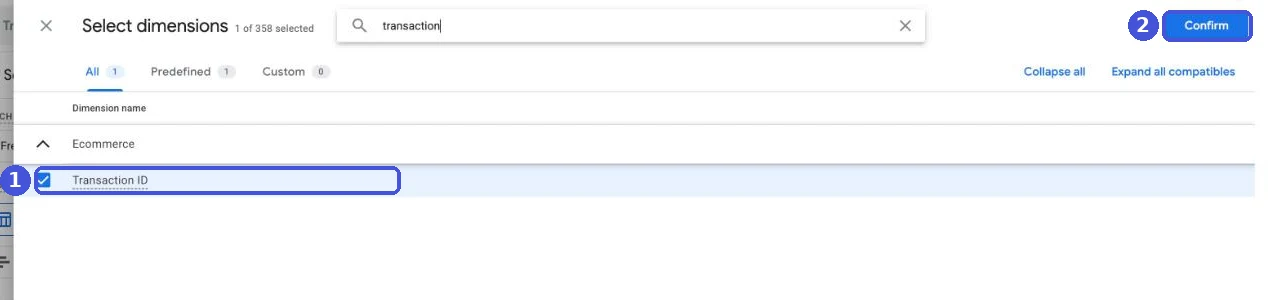
The full steps are in GA4 Not Tracking All Shopify Purchases? We also built a Shopify app, GapFill, that recovers missing GA4 purchase events server-side. It’s our own product, so read with that in mind. It works alongside your existing tags, and the missing purchases report is free.
Our Shopify appGapFill: Recover missing GA4 purchase events server-sideWorks alongside your existing tags. Free missing purchases report.See GapFill →Beyond that, when exploration numbers don’t match standard reports or Shopify, check these four things.
Set data retention to 14 months
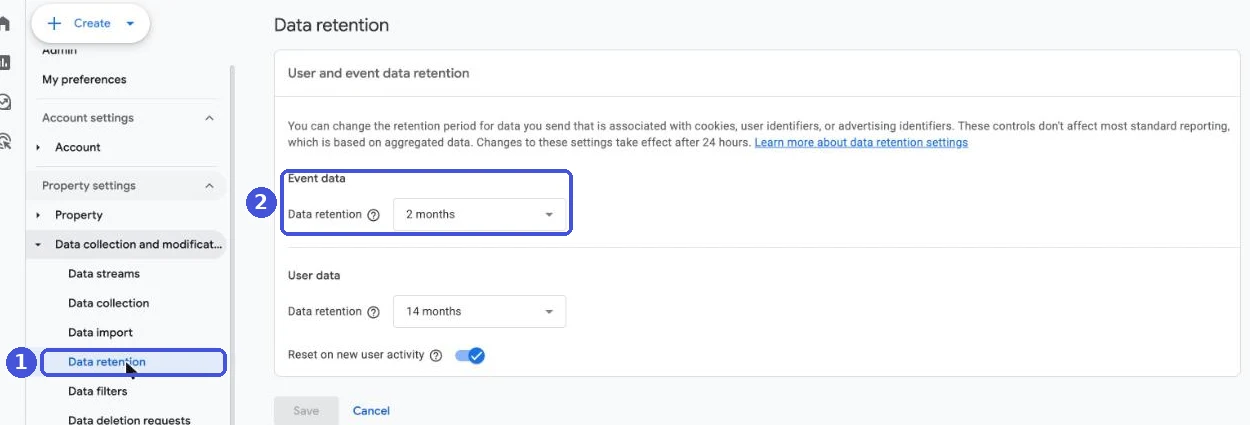
Explorations can only query data within your data retention period. Standard GA4 properties can keep event data for 2 or 14 months, and the default is 2 months. At 2 months, you can’t compare with the same month last year in an exploration.
Change it in Admin under Data collection and modification > Data retention. The page has separate retention settings for event data and user data. The one that controls how far back explorations go is Event data retention, so set that to 14 months; it’s possible to have user data at 14 months while event data is still at 2. Google’s help says the retention setting only affects explorations and funnel reports, not standard aggregated reports. Raising it doesn’t bring back data that’s already been deleted, so change it as soon as you set up GA4.
Sampling and thresholds
In standard GA4 properties, a query that covers more than 10 million events can be sampled, meaning GA4 estimates the totals from a subset of the data. Separately, when demographic or Google signals data is involved, data thresholds can hide rows with small numbers of users.
The data quality icon at the top right of the exploration shows when either applies, including the percentage of data used when results are sampled. If it does, lighten the query: shorten the date range or remove dimensions.
Dimensions and metrics with mismatched scope
Every GA4 dimension and metric is counted at a particular level, or scope: user, session, event or item. Combine different scopes and the numbers drift, or GA4 won’t let you combine them at all. Two cases come up most in explorations:
- Put Item name in the rows and Purchase revenue and Ecommerce purchases turn gray and can’t be selected. For revenue by product, use Item revenue and Items purchased.
- Put Landing page (one per session) next to Page title (one per page view) and a single visit is split across several rows, so adding up the Sessions column overstates the real total.
Limits and sharing rules
Each user can create up to 200 explorations per property, and each property can hold up to 500 shared explorations. Shared explorations are view-only for others; anyone who wants to edit one duplicates it. To share, you need at least the Analyst role on the property.
For the rest of GA4’s day-to-day reports, see How to Use GA4, and for what each metric means, see GA4 Metrics Explained.
Sources
- [GA4] Get started with Explorations (Google Analytics Help)
- [GA4] Data retention (Google Analytics Help)
- [GA4] About data sampling (Google Analytics Help)
- [GA4] Path exploration (Google Analytics Help)
- [GA4] Funnel exploration (Google Analytics Help)
- [GA4] Cohort exploration (Google Analytics Help)
- [GA4] About segments (Google Analytics Help)
FAQ
Where do I find Explorations in GA4?
Click Explore in the left navigation. To create one, start from Blank or pick a template such as Free form or Funnel exploration. The other techniques are in the Template gallery.
What's the difference between Explorations and standard reports?
Standard reports are fixed views that everyone with access sees the same way. Explorations let you pick your own dimensions, metrics and segments. An exploration is visible only to the person who created it until it's shared, and people it's shared with can view it but not edit it.
Why can't I see last year's data in Explorations?
Your event data retention is probably still at the default of 2 months. Explorations can only query data within the retention period. You can change it to 14 months in Admin under Data collection and modification > Data retention, but data that has already been deleted won't come back.
Why don't my exploration numbers match standard reports?
Usually for one of three reasons: the date range reaches past your data retention period, the query is large enough to be sampled, or data thresholds are hiding rows because demographic or Google signals data is involved. The data quality icon at the top right of the exploration tells you when sampling or thresholds apply.
Can I share an exploration with someone else?
Yes. Shared explorations can be viewed by anyone with access to the property, but not edited; to make changes, they duplicate it. You need at least the Analyst role on the property to share. Each property can hold up to 500 shared explorations.
- Explorations let you build analysis standard reports can't do. Open them from Explore in the left navigation.
- There are seven techniques. For ecommerce, four matter most: funnel, path, segment overlap and cohort.
- A funnel exploration shows where shoppers drop off between viewing a product and buying. Up to 10 steps.
- A path exploration with purchase as the ending point shows what buyers looked at before buying.
- Explorations only cover your data retention period. Change it from the default 2 months to 14 months.
- When numbers don't match, check retention, sampling, thresholds and scope.
Written byRyushi Nagata
CEO, ULTRO Inc. (Tokyo)Shopify Partner. Ryushi handles Shopify store builds, maintenance, advertising and CRM end to end, and has managed more than ¥4 billion in ad spend over his career. He holds Google Ads certifications (Search, Display, Video, Shopping, Apps, Performance Max, Measurement) and the Google Analytics certification.
How many purchases is GA4 missing in your store?
GapFill matches your Shopify orders against GA4 purchases, shows what GA4 missed, and recovers those purchase events server-side. It works alongside your existing tags, and the missing purchases report is free.