How to Use Google Analytics 4 for Ecommerce: 4 Reports and 5 Fixes

The eight metrics to know first, the four reports an online store should check and in what order, User acquisition vs Traffic acquisition, the settings to fix first, and how to connect Shopify.
Open GA4 and there are so many reports that it’s hard to know where to start. Most guides cover everything from the interface to Explorations, but they rarely say what someone running an online store should actually check each week.
This article narrows it down to four reports for an online store (especially on Shopify), with the order to check them in and how to read each one. It also covers the settings to fix right after setup so the numbers stay accurate. Screens are as of October 2026.
GA4 is split into five sections
GA4’s left navigation has five sections:
| Section | What it’s for |
|---|---|
| Home | Frequently used numbers and recently opened reports |
| Reports | Predefined summaries. Check your weekly numbers here |
| Explore | Pick your own dimensions and dig deeper |
| Advertising | Ad performance and attribution comparisons |
| Admin | Data collection, retention, permissions and links to other products |
Check your weekly numbers in Reports, and when something makes you ask “why?”, dig into it in Explore. For how to use Explorations, see our guide to GA4 Explorations.
The left menu in Reports depends on the property
The left menu under Reports isn’t the same on every property. If business information (such as your industry) was entered when the property was created, you get the Business objectives collection, with topics such as Generate leads and Drive sales. Otherwise you get the Life cycle collection: Acquisition, Engagement, Monetization and Retention. The Life cycle collection is also the default for properties created before March 27, 2023.
This article uses the Business objectives names. On properties with the Life cycle collection, Traffic acquisition is under Acquisition, Ecommerce purchases under Monetization, and Landing page under Engagement.
The eight metrics to know first
Before reading reports, get clear on what the common metrics mean. For an online store, these eight cover almost everything you check each week.
| Metric | What it counts | More detail |
|---|---|---|
| Users (Active users) | People who used your site during the period. “Users” in reports means this number | Users vs sessions |
| New users | People who visited for the first time during the period | Users vs sessions |
| Sessions | Visits. By default, a new session starts after 30 minutes of inactivity | Users vs sessions |
| Views | Pages opened. The equivalent of pageviews in Universal Analytics | Users vs sessions |
| Engagement rate | Share of sessions that lasted longer than 10 seconds (by default), had 2 or more page views, or had a key event | |
| Key events | Count of events you’ve decided to treat as outcomes, such as purchases | Key events |
| Total revenue | Revenue from purchases and other sources, minus refunds | |
| Transactions | Number of purchases |
The difference between users and sessions, and how key events are counted, are common reasons numbers don’t match, so they have their own articles linked above. For the rest of the metrics, see our GA4 metrics list.
The four reports to check first
An online store can narrow its weekly reports down to four. Starting with the change in sales and moving on to sources, products and entry pages takes you from what changed to why. Here’s the order at a glance.
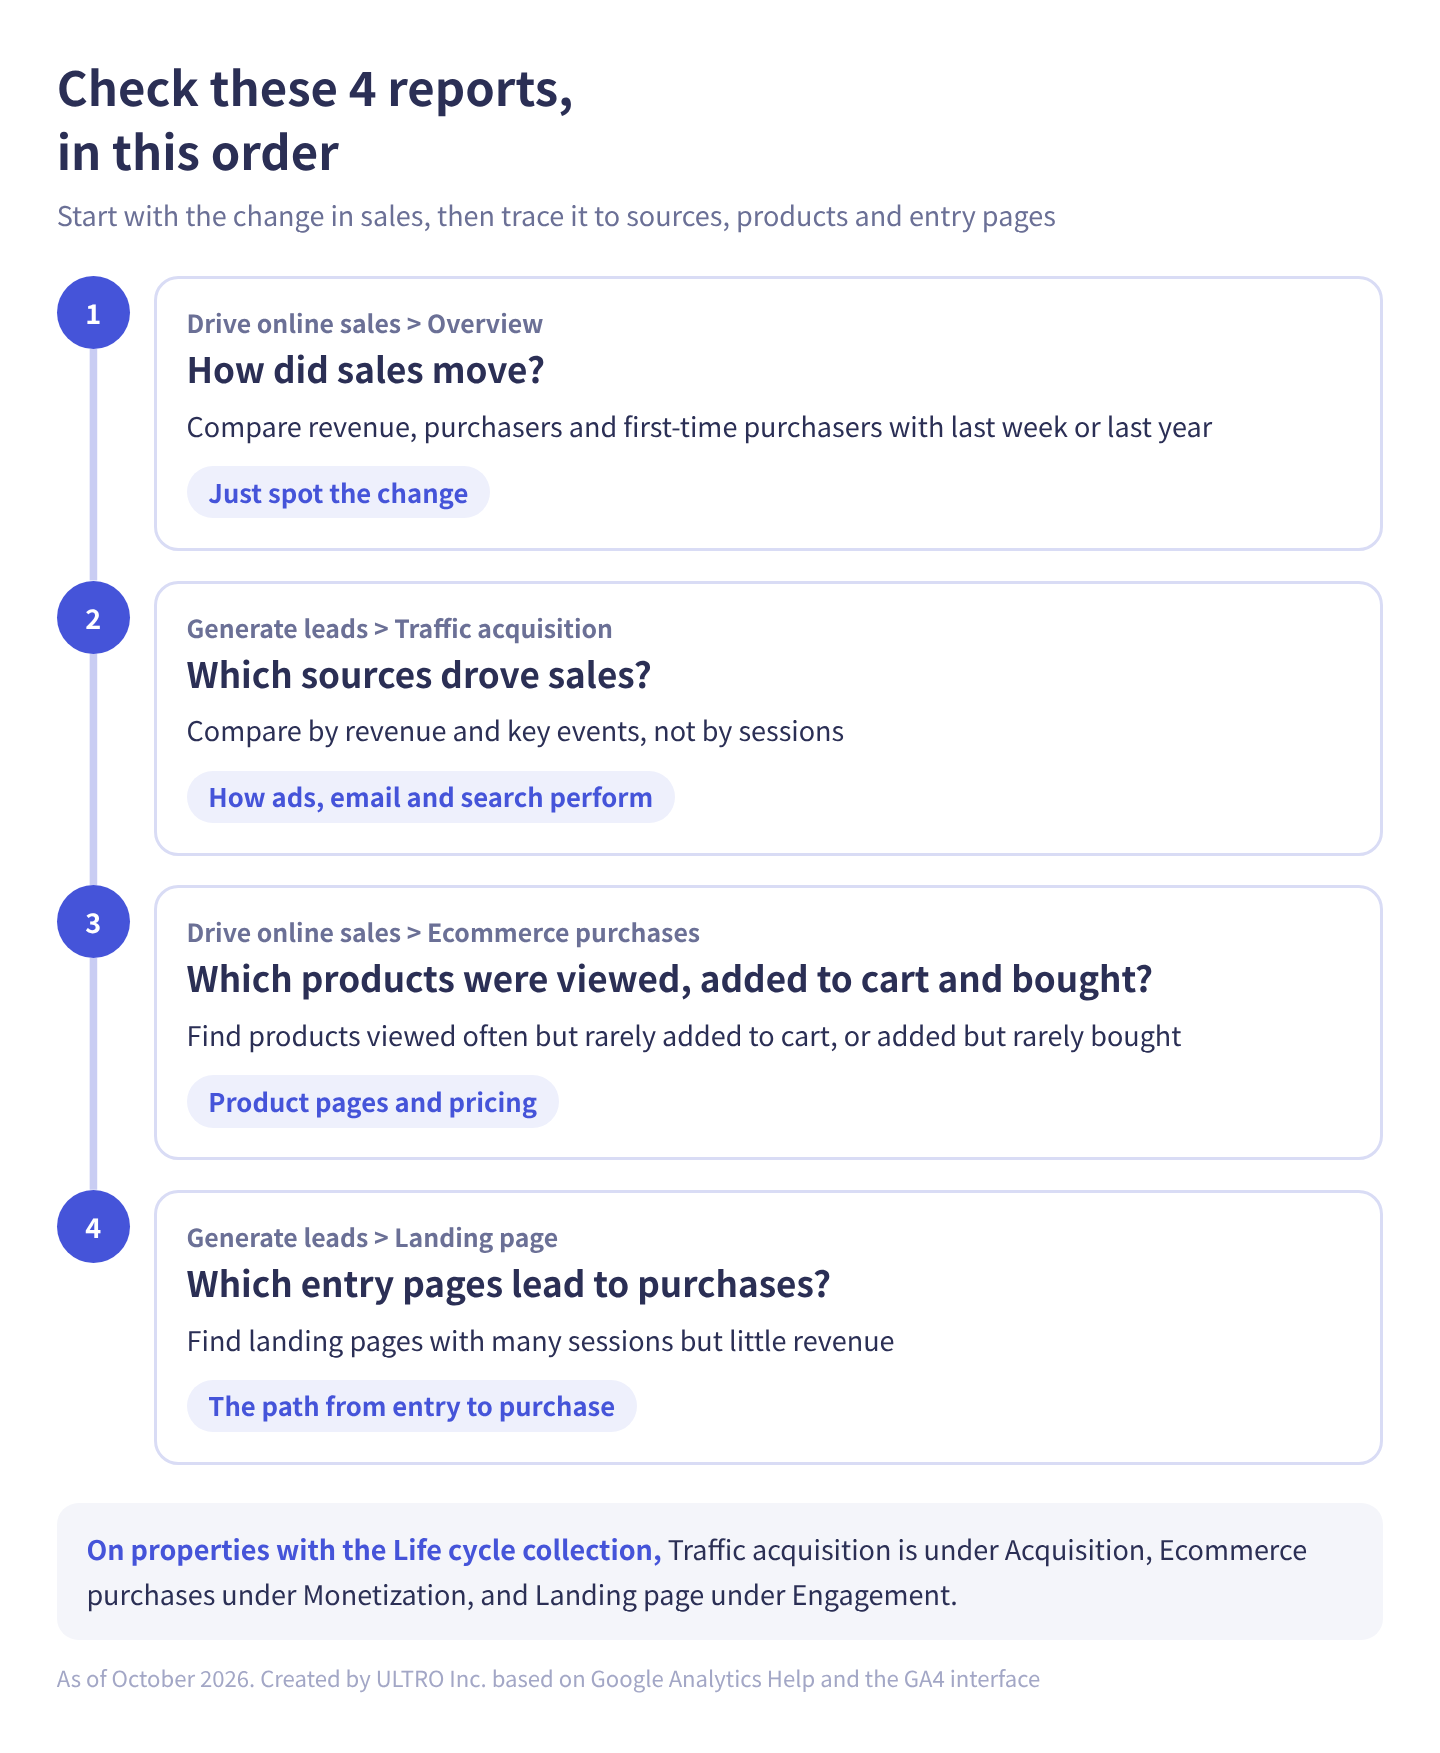
In table form:
| Order | Report | Where | Question it answers |
|---|---|---|---|
| 1 | Overview | Drive sales | How did revenue and purchasers move compared with last week? |
| 2 | Traffic acquisition | Generate leads | Which sources drove sales? |
| 3 | Ecommerce purchases | Drive sales | Which products were viewed, added to cart and bought? |
| 4 | Landing page | Generate leads | Which entry pages lead to purchases? |
Why only four? Scanning every report rarely leads anywhere. Deciding in advance which reports you check each week, and what question each one answers, gets you to a cause faster.
1. Drive sales Overview: how did sales move?
In the Drive sales Overview, look at how revenue, purchasers and first-time purchasers moved. Change the date range at the top right and compare with last week or the same period last year.
All you’re looking for here is whether something changed. The next three reports tell you why.
2. Traffic acquisition: which sources drove sales?
Traffic acquisition under Generate leads breaks sessions down by where they came from. By default, it uses Session primary channel group, which splits traffic into channels such as Organic Search, Paid Search, Email and Organic Social.
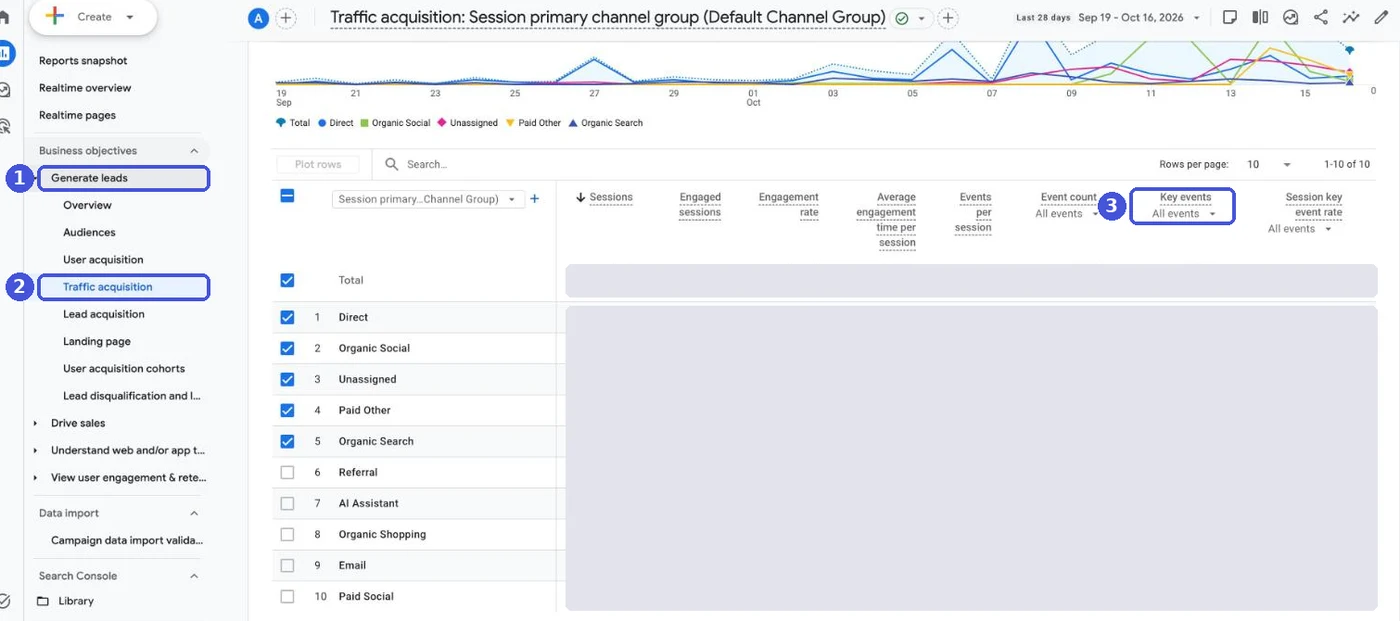
Scroll the table to the right for the Key events and Total revenue columns. Look at the sources that bring in the most revenue, not the most sessions. If ads or emails aren’t split out correctly, review how your URLs are tagged; see our UTM parameters guide.
The report people mix this up with is User acquisition, right above it.
| User acquisition | Traffic acquisition | |
|---|---|---|
| What it counts | Where new users came from on their first visit | Where each session came from, new or returning |
| Dimension names | “First user …” | “Session …” |
| When to use it | To see which channels bring in new customers | To track ads and email day to day |
The numbers here often don’t match your ad platforms or Shopify. That’s because each counts differently; see our attribution guide for why.
3. Ecommerce purchases: which products sold?
Ecommerce purchases under Drive sales lists, for each product, Items viewed, Items added to cart, Items purchased and Item revenue.
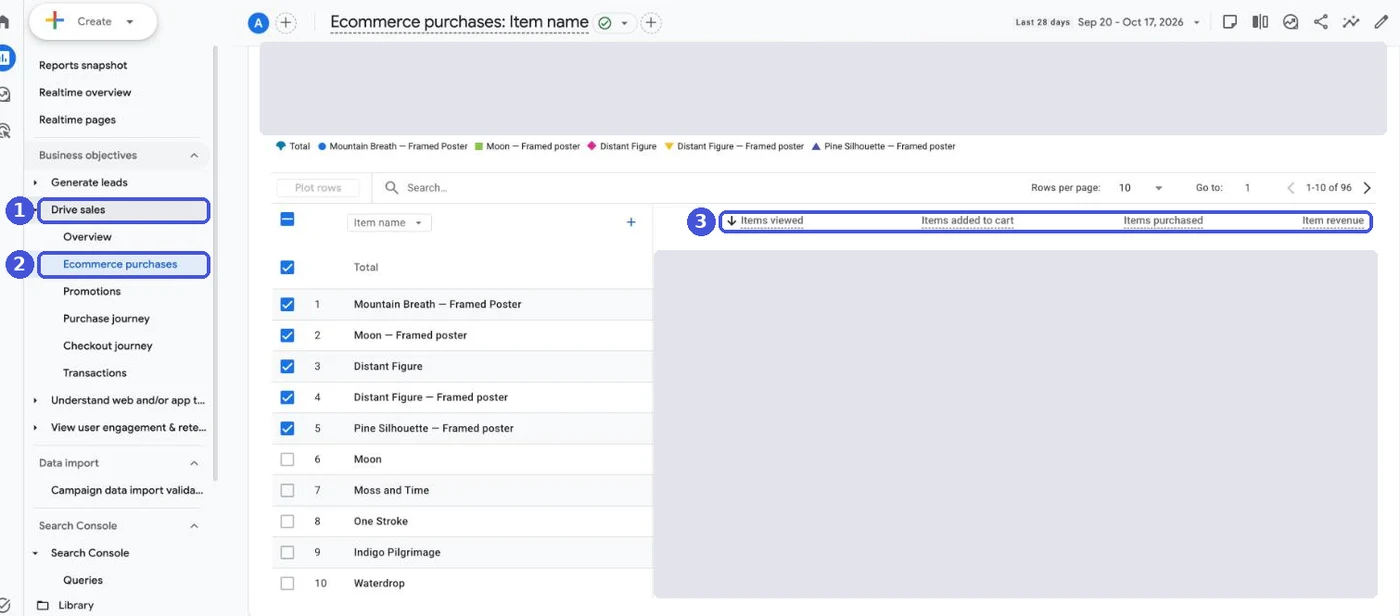
Look at the ratios for each product. A product that gets lots of views but few add-to-carts isn’t giving shoppers enough reason to buy on its product page. If a product gets added to cart but rarely bought, check shipping costs, stock and how the price is presented.
For this report to show data, view_item, add_to_cart and purchase events have to be sent along with item information. On Shopify, they are if you’ve connected through the Google & YouTube app, covered below. For GA4’s event types and the parameters ecommerce events need, see our guide to GA4 events.
4. Landing page: which entry pages lead to purchases?
The Landing page report under Generate leads lists sessions, key events and total revenue for each page where a session started.
Check whether the pages people land on from ads and search actually turn into sales. For a landing page with many sessions but little revenue, review the path from that page to product pages and checkout. To see exactly where people drop off, use a funnel exploration in Explore.
When reports can’t tell you why, use Explorations
The four reports are predefined summaries, so they can’t tell you where shoppers stop or who comes back for a second purchase. For that, go to Explore and choose the dimensions yourself. Here’s how what you notice in reports maps to exploration techniques:
| What you noticed in reports | Exploration technique | What it tells you |
|---|---|---|
| Some sources bring in much more revenue than others | Segment overlap | Which traffic sources produce visitors who go on to buy |
| A product gets lots of views but few purchases | Funnel exploration | Whether shoppers stop at the product page, cart or checkout |
| A landing page brings in little revenue | Path exploration | Which pages buyers viewed before purchasing |
| First-time purchasers are up, but sales aren’t | Cohort exploration | Whether first-time buyers come back for a second purchase |
For how to build each one and read it for an online store, see our guide to GA4 Explorations.
Because Explorations let you combine any dimension with any metric, some combinations change what a number means. For example, look at product-level sales with Item revenue, not Purchase revenue. Mixing event-scoped and item-scoped fields is the usual cause; our custom dimensions guide explains scopes.
Settings to fix first
To keep report numbers accurate, take care of these five things right after setting up GA4. Here they are at a glance.
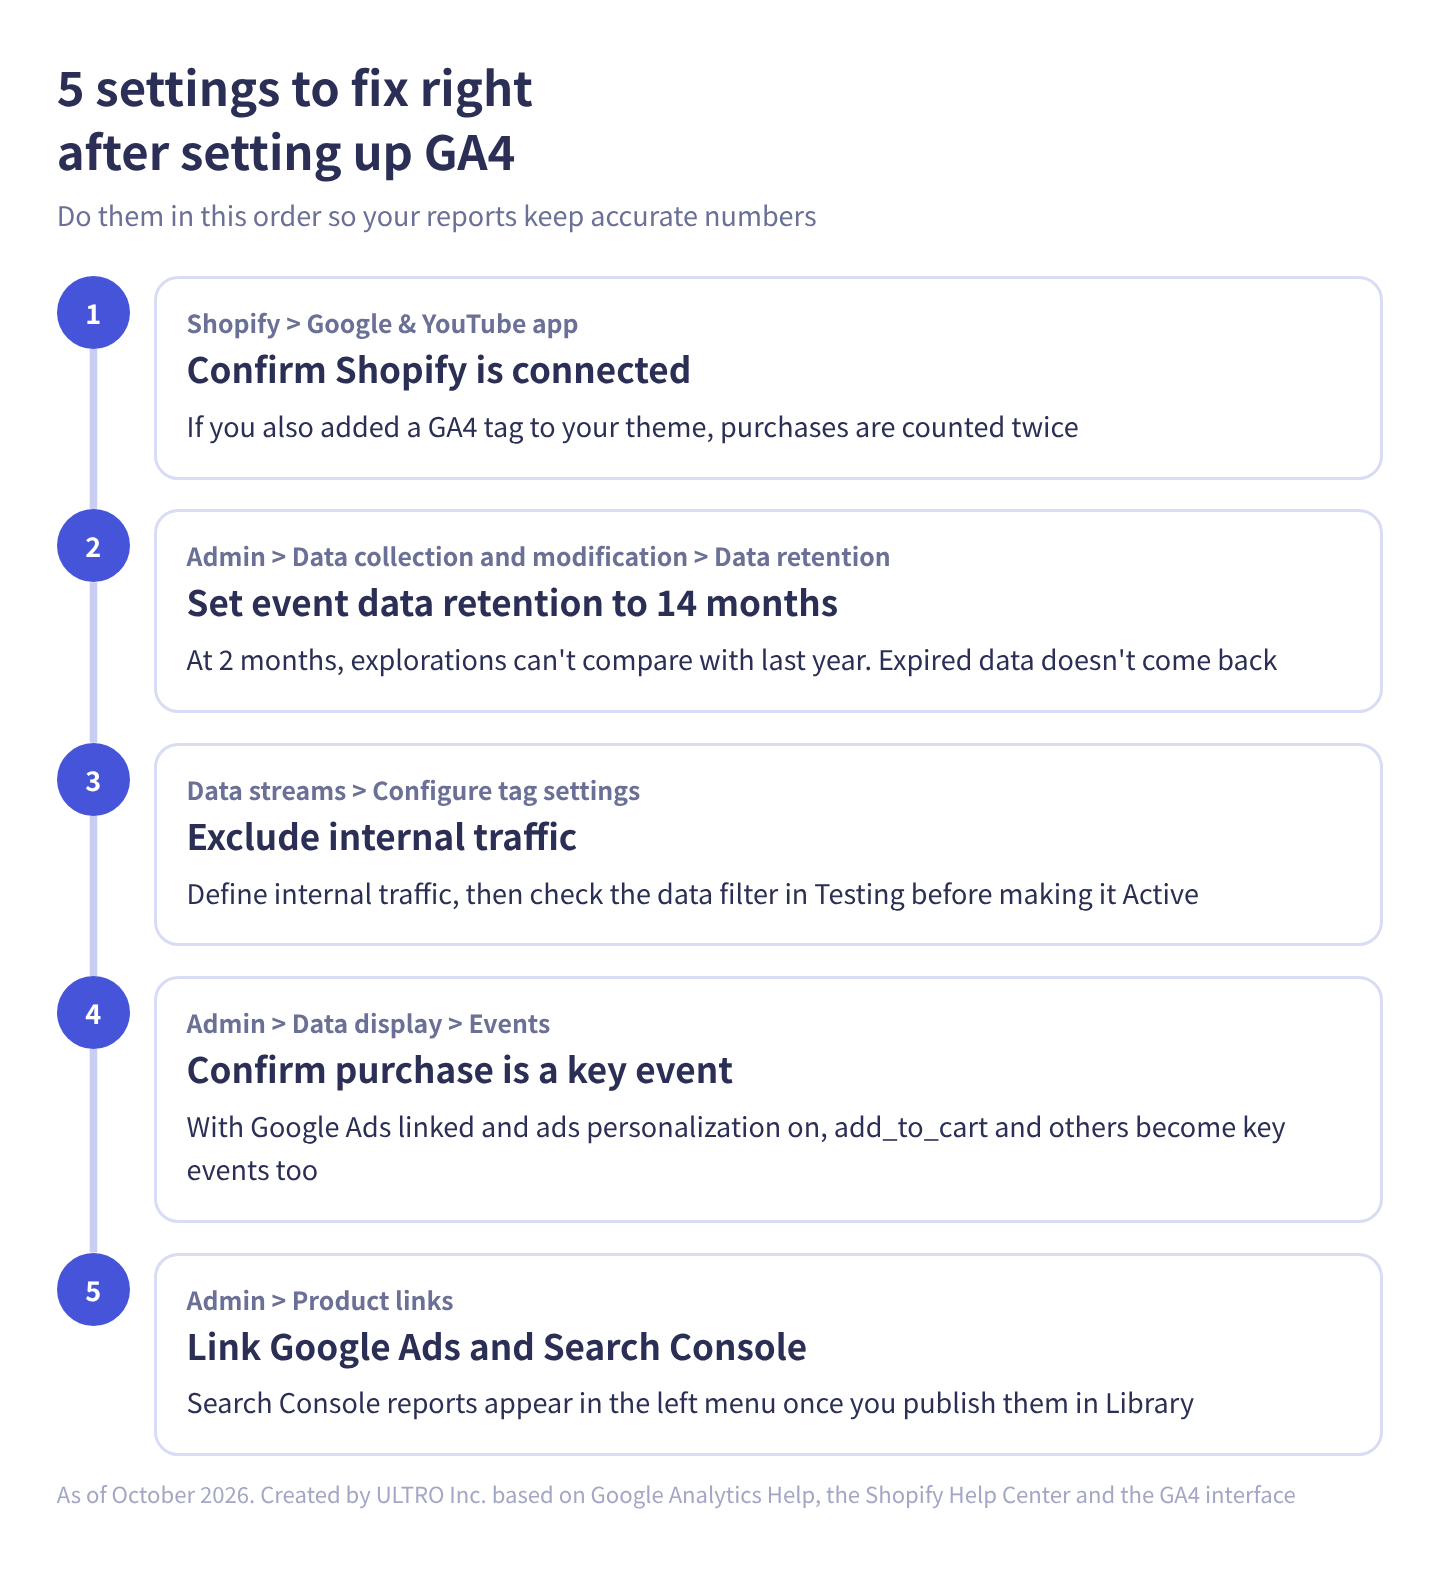
Here’s each one in detail.
1. Confirm Shopify is connected
To connect a Shopify store to GA4, install Shopify’s Google & YouTube app and choose your GA4 property. It then sends events such as page_view, view_item, add_to_cart, begin_checkout, add_payment_info and purchase to GA4 automatically.
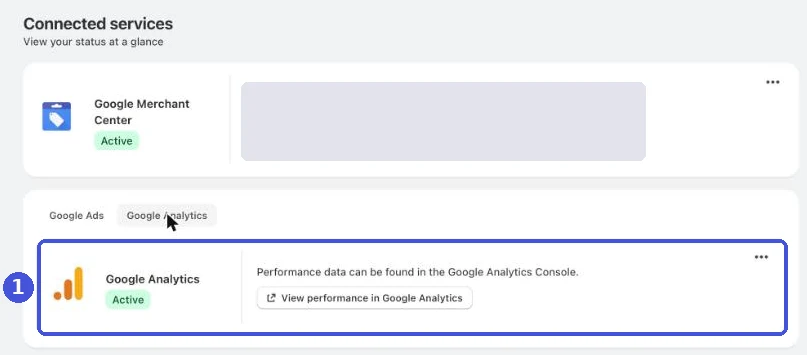
Be careful if you’ve also added a GA4 tag to your theme yourself. Sending from both counts every purchase twice, so use one or the other; see why GA4 records duplicate purchases. Also, GA4 can’t track events while the store is password-protected. For the full setup steps, see how to set up GA4 on Shopify.
Connecting the app doesn’t get every purchase into GA4. Purchases where the buyer paid on an external payment page and never returned to the Thank you page, or where an ad blocker stopped the tag, never reach GA4. To see how many are missing, match Shopify orders against GA4 transaction IDs. Depending on your tag, the transaction ID holds either the order number (such as #1001) or the long numeric order ID, so compare a few first. The steps are in GA4 Not Tracking All Shopify Purchases? We built a Shopify app for this, GapFill. It’s our own product, so read with that in mind. It recovers missing GA4 purchase events server-side, works alongside your existing tags, and the missing purchases report is free.
Our Shopify appGapFill: Recover missing GA4 purchase events server-sideWorks alongside your existing tags. Free missing purchases report.See GapFill →2. Set event data retention to 14 months
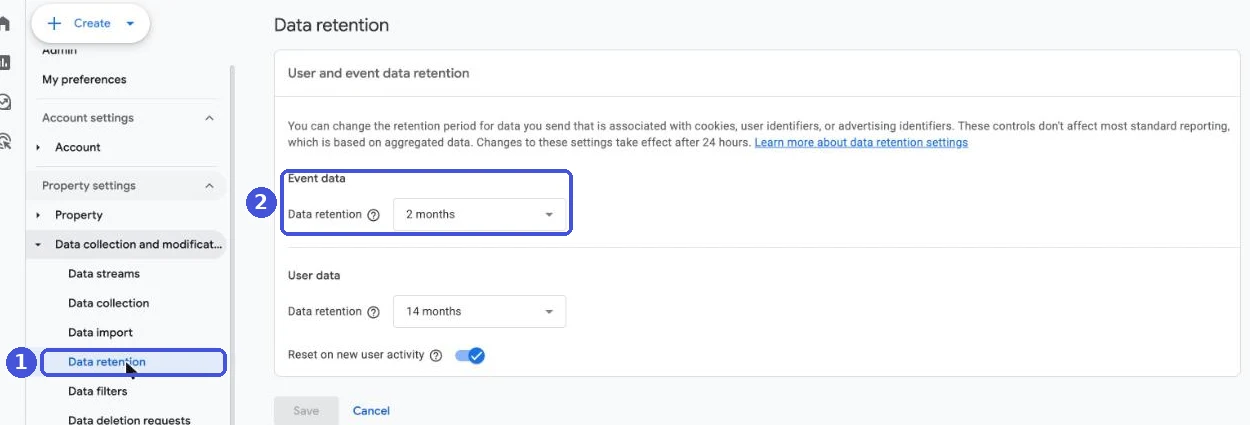
In Admin, under Data collection and modification, open Data retention and change Event data retention from 2 months to 14 months. At 2 months, you can’t compare with last year in Explorations. Changing it doesn’t bring back data that has already expired, so do it first. Standard reports aren’t affected by this setting.
3. Exclude internal traffic
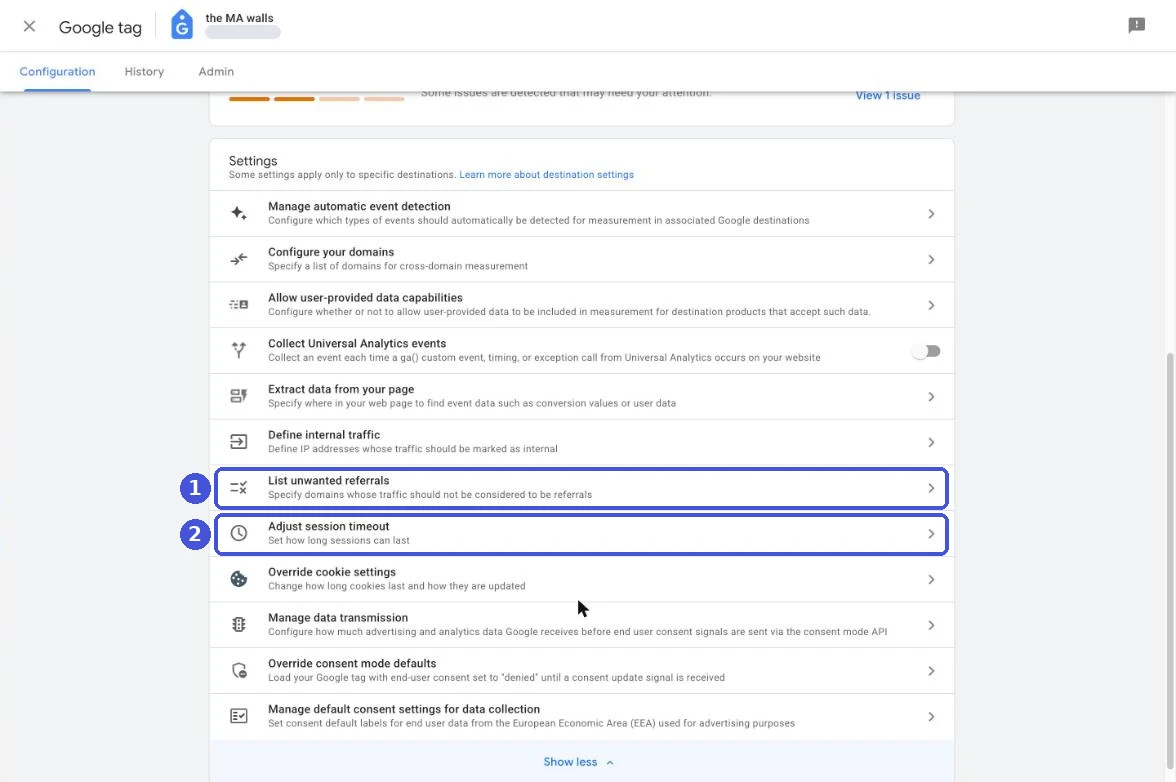
When your own team browses the store or places test orders, the numbers come out higher than reality. In Admin, open Data streams, select your web stream, click Configure tag settings, then Show more, and under Define internal traffic, register your office IP addresses. Then exclude them with a data filter (Admin > Data collection and modification > Data filters). Leave the filter in Testing first to check how it behaves, then make it Active. Data excluded by an active filter can’t be recovered.
4. Confirm purchase is a key event
Key events are the events that matter to your business, such as purchases or inquiries. They used to be called conversions. In Admin, under Data display, select Events, and click the star next to an event name to mark it as a key event.
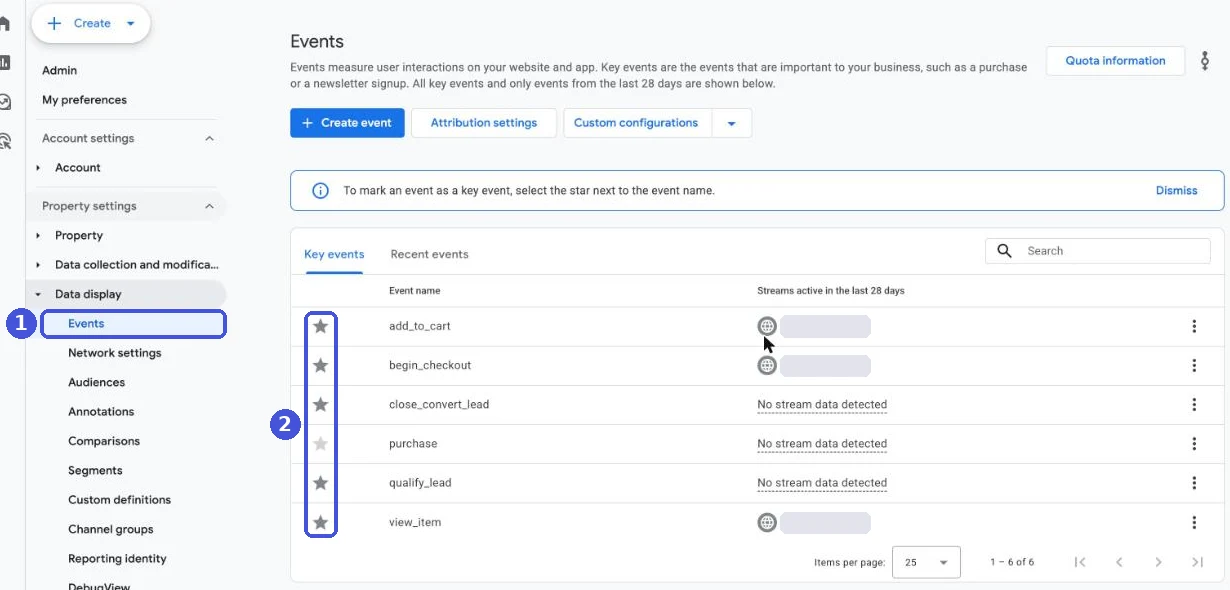
For an online store, make sure purchase is marked as a key event. purchase is one of the events GA4 treats as a key event by default.
The catch is that other events can join it. If Google Ads is linked and ads personalization is on, add_to_cart, add_to_wishlist, begin_checkout, session_start, view_item, view_item_list and view_search_results can be marked as key events too. The Key events column in reports then includes more than purchases. When you look at that column in Traffic acquisition or elsewhere, switch the “All events” dropdown above the column to purchase.
For counting methods and why GA4 doesn’t match Google Ads, see our guide to GA4 key events.
5. Link Google Ads and Search Console
In Admin, under Product links, link Google Ads and Search Console.
- Linking Google Ads lets you see ad clicks and cost in GA4, and use GA4 key events and audiences in Google Ads
- Linking Search Console lets you see search queries and positions in GA4 reports. After linking, publish the Search Console collection in Library so it shows up in the left menu
For how Google Ads conversions relate to GA4, see Google Ads conversion tracking.
Sources
- [GA4] Default reports and report collections (Google Analytics Help)
- [GA4] User acquisition report (Google Analytics Help)
- [GA4] Traffic acquisition report (Google Analytics Help)
- [GA4] Ecommerce purchases report (Google Analytics Help)
- [GA4] Landing page report (Google Analytics Help)
- [GA4] Data retention (Google Analytics Help)
- [GA4] Exclude internal traffic (Google Analytics Help)
- [GA4] Mark events as key events (Google Analytics Help)
- [GA4] Link Google Ads to Google Analytics (Google Analytics Help)
- [GA4] Search Console integration (Google Analytics Help)
- Setting up Google Analytics (Shopify Help Center)
- Shopify event parameters (Google Tag Platform)
FAQ
Which GA4 reports should an online store check first?
The Drive sales Overview, Traffic acquisition, Ecommerce purchases and Landing page. Look at how sales changed, then which sources drove it, which products sold, and which entry pages led to purchases. That tells you what to fix next.
What's the difference between User acquisition and Traffic acquisition?
User acquisition counts where new users came from on their first visit. Traffic acquisition counts where each session came from, whether the user is new or returning. To track ads and email day to day, use Traffic acquisition.
I can't find Acquisition or Engagement in the left menu of Reports.
The left menu depends on the property. If business information was entered when the property was created, reports are grouped under Business objectives, such as Generate leads and Drive sales. Traffic acquisition is under Generate leads, and Ecommerce purchases is under Drive sales.
How do I connect Shopify to GA4?
Install Shopify's Google & YouTube app and connect it to your GA4 property. It then sends events such as product views, add to cart, begin checkout and purchase automatically. If you've also added a GA4 tag to your theme, purchases are counted twice, so use only one.
What should I set up first after installing GA4?
Set event data retention to 14 months, exclude internal traffic, make sure purchase is a key event, and link Google Ads and Search Console. Change retention first: extending it later doesn't bring back data that has already expired.
What does Users count in GA4 reports?
Active users: people who had an engaged session or visited for the first time during the period. It's a different metric from Total users, which counts everyone who visited.
- The eight metrics to know first: users, new users, sessions, views, engagement rate, key events, total revenue and transactions
- The four reports to check first: the Drive sales Overview, Traffic acquisition, Ecommerce purchases and Landing page
- Check them in the order change in sales → source → product → entry page to trace a change to its cause
- User acquisition is where new users first came from; Traffic acquisition is where each session came from
- Depending on the property, the left menu is grouped by Business objectives instead of the Life cycle collection
- The settings to fix first: the Shopify connection, event data retention, internal traffic, key events and product links
Written byRyushi Nagata
CEO, ULTRO Inc. (Tokyo)Shopify Partner. Ryushi handles Shopify store builds, maintenance, advertising and CRM end to end, and has managed more than ¥4 billion in ad spend over his career. He holds Google Ads certifications (Search, Display, Video, Shopping, Apps, Performance Max, Measurement) and the Google Analytics certification.
How many purchases is GA4 missing in your store?
GapFill matches your Shopify orders against GA4 purchases, shows what GA4 missed, and recovers those purchase events server-side. It works alongside your existing tags, and the missing purchases report is free.