Marketing Attribution: Why GA4, Ads and Shopify Numbers Differ

How one purchase is counted in four tools, six reasons the numbers never match, each tool's defaults, why GA4 credits different sources in different reports, and which number an online store should use for what.
Your ad platforms show 50 purchases, GA4 shows 32, and Shopify shows 41 orders. Same store, same period, three different numbers. Every time you share a report, someone asks which one is right, and it’s hard to give a clean answer. If you work with ecommerce numbers, you’ve probably been there.
The short answer: none of them is wrong. Each one counts by different rules, and those rules are attribution.
Most articles on attribution focus on the types of models. But many of the models those articles list have already been removed. The problem stores actually run into today is less about choosing a model and more about each tool counting differently.
Below: what attribution means, how GA4, Google Ads, Meta Ads and Shopify count differently, why the numbers don’t match, and which number an online store should use for what. Tool specs come from official help pages as of October 2026. Where we couldn’t confirm something for Meta Ads in Meta’s own help, we say so.
What is marketing attribution?
Attribution is deciding which of the ads and channels a buyer touched gets credit for the purchase.
Customers don’t always buy on the first touch. They see an ad on Instagram, search for the product a few days later, and buy from a link in your email. On that path, three touchpoints contributed to one purchase. The rule that decides where the credit goes is the attribution model.
| Model | How credit is assigned |
|---|---|
| Last click | All of it goes to the last touchpoint clicked |
| Data-driven | Each touchpoint’s contribution is estimated and credit is split |
These two are what GA4 and Google Ads mainly use today.
There used to be more: first click (all credit to the first touchpoint), linear (split evenly), time decay (more credit to touchpoints closer to the purchase) and position-based (more credit to the first and last). GA4 removed those four in November 2023, and Google Ads dropped them too. Some articles still describe “five attribution models,” but you can no longer pick them.
One purchase, seen in four tools
The fastest way to see why the numbers differ is an example. Say a customer did this:
| Day | What they did |
|---|---|
| Day 1 | Clicked an Instagram ad, looked at the product page, left |
| Day 4 | Searched for the product name, clicked a Google search ad, added to cart, left |
| Day 6 | Searched for the product name again, came in through a regular (organic) search result and bought |
That’s one actual order. Here’s how each tool counts it on default settings.
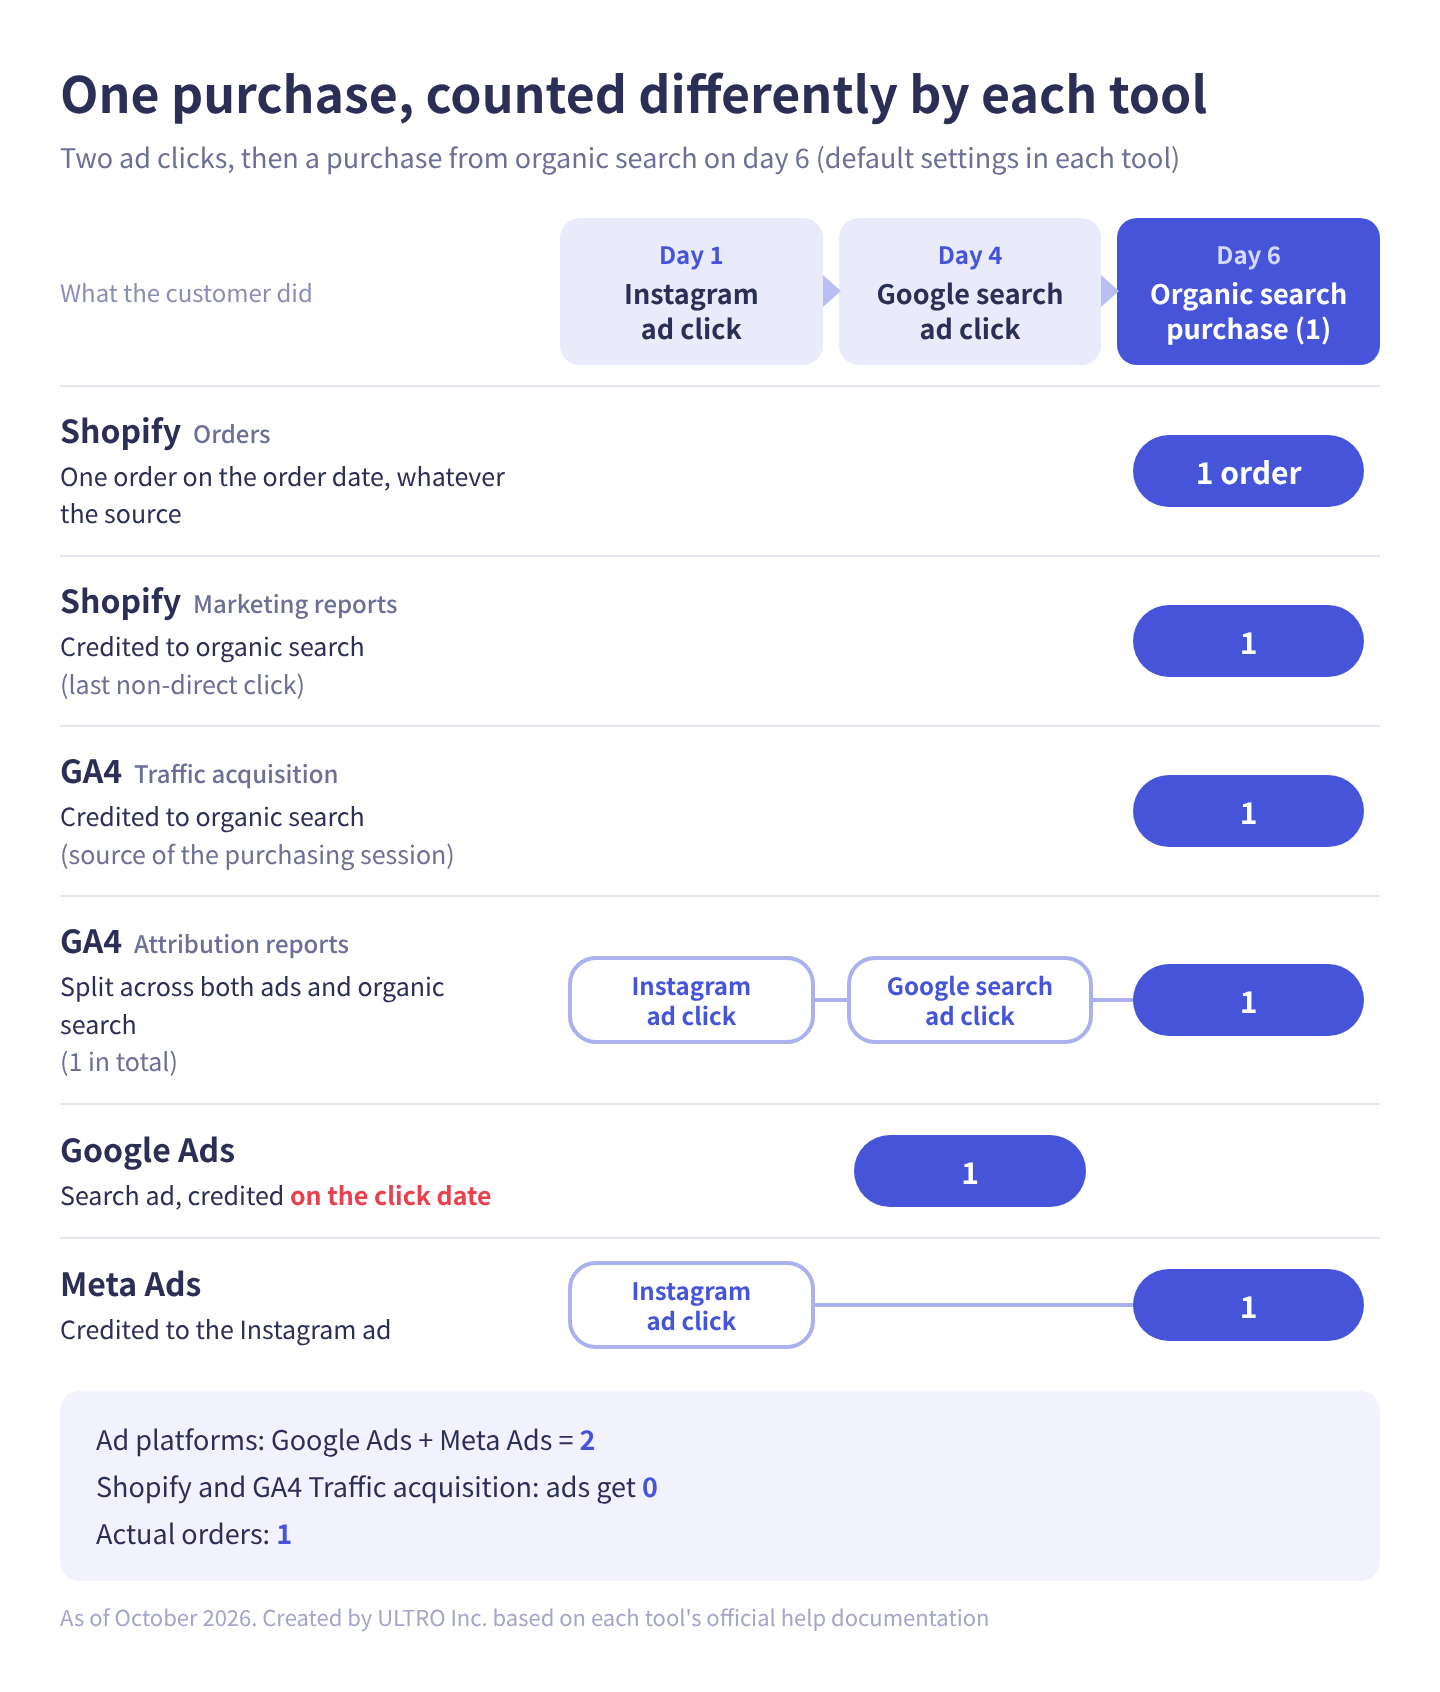
As a table:
| Tool | How it’s counted | Date recorded |
|---|---|---|
| Shopify (orders) | 1 order | Day 6 |
| Shopify (marketing reports) | 1 to organic search: last non-direct click | Day 6 |
| GA4 (Traffic acquisition) | 1 to organic search: source of the purchasing session | Day 6 |
| GA4 (attribution reports) | Split across the Instagram ad, the search ad and organic search by contribution (1 in total) | Day 6 |
| Google Ads | 1 to the search ad | Day 4 (the click date) |
| Meta Ads | 1 to the Instagram ad | Day 6 |
Four things stand out.
Google Ads and Meta Ads each count one. That’s two, but there was one order. Each platform counts a purchase after its own ad click as its own result. Neither can see whether the buyer also clicked another platform’s ad.
Shopify and GA4 Traffic acquisition give the ads zero. Both credit organic search, the source of the session where the purchase happened. Even with two ad clicks, these views show no ad result. The ad platforms show two, these show zero, for the same single order.
GA4’s attribution reports split the purchase so it adds up to one. GA4 sees every channel, so it divides one purchase across several touchpoints. That’s why the search ad’s credit here is smaller than in Google Ads.
The dates differ. Google Ads records the conversion on the day of the ad click, not the purchase. Someone who clicks at the end of one month and buys the next shows up in the earlier month in Google Ads and in the later month in GA4 and Shopify.
Six reasons attribution numbers don’t match
Here’s what drives the differences in that example.
1. Different rules for who gets credit
Ad platforms look only at their own ads. GA4 looks at every channel and, depending on the report, credits the source of the purchasing session or splits credit across touchpoints. Shopify’s marketing reports credit the last non-direct click. Same purchase, different scope and different rules.
2. Different lookback windows
How far back before the purchase a touchpoint can count varies by tool.
| Tool | Default window |
|---|---|
| GA4 | 90 days for key events such as purchases |
| Google Ads | 30 days from the click |
| Meta Ads | 7 days after a link click, 1 day after a view, 1 day after a non-link engagement |
Meta’s attribution settings offer 1 or 7 days after a link click, 1 day after viewing, and 1 day for engage-through (non-link interactions). The table shows the longest combination available.
For products with a long consideration period, such as expensive items, this gap gets big. Someone who buys 20 days after clicking an ad counts in Google Ads but not in Meta Ads.
3. Whether people who only saw an ad count
The tools also treat buyers who saw an ad without clicking differently.
- Meta Ads: purchases within 1 day of seeing an ad are commonly included. Purchases within 1 day of a like, save or a video view of 5 seconds or more can also be included as engage-through.
- Google Ads: purchases by people who only saw an ad are reported as view-through conversions in a separate column and aren’t included in the Conversions column. Engaged-view conversions from video ads, where someone watched for a certain length, are included in Conversions.
- GA4: based on clicks. Only YouTube video ads watched beyond a certain point count as touchpoints.
- Shopify: clicks only.
Social ads really can drive purchases without a click. But a buyer who was going to buy anyway and simply had an ad shown to them also gets counted. This is the biggest reason Meta’s numbers come out higher than GA4’s.
Since January 12, 2026, Meta’s Ads Insights API no longer returns 7-day and 28-day view windows (per Meta’s developer announcement). And since March 2026, Meta counts only purchases after a link click as click-through conversions. Purchases after a like, comment, share, save, a click elsewhere on the ad, or a video view of 5 seconds or more are reported separately as engage-through, within 1 day. When we checked on October 9, 2026, Ads Manager also displayed a notice to that effect.
This brings Meta’s “click” closer to how GA4 counts people who arrive from an ad. If you compare current click numbers with older ones, remember the definition changed. You can view engage-through conversions separately using the comparison option in Ads Manager’s attribution settings. Meta’s help notes that some accounts may still use the previous counting during the transition.
4. Different dates
| Tool | Date credited |
|---|---|
| Google Ads | The day the ad was clicked |
| GA4 | The day the purchase happened |
| Shopify | The day the order was placed |
| Meta Ads | For website purchases, the day the purchase happened (per Meta’s developer documentation) |
Google Ads’ Conversions column is calculated from the time of the click. That means recent days’ numbers keep growing: if someone clicks today and buys next week, today’s conversions go up by one. That’s why last week’s numbers look different on Monday than they do a week later.
Google Ads also has a column that reports by the time of the conversion: Conversions (by conv. time). Use it when comparing day by day with GA4 or Shopify.
5. Modeled conversions
GA4 and Google Ads both fill in what they couldn’t measure directly with modeled data, such as:
- People who didn’t consent to cookies
- People who clicked an ad on their phone and bought on a computer
- People whose tracking was cut off by browser restrictions
Google Ads’ Conversions column can include both observed and modeled conversions. GA4’s attributed key event data can also include modeled conversions and may be updated for up to 12 days after the conversion is recorded.
Each tool models differently, so this adds to the gap.
6. What each tool can track at all
GA4 and ad tags run in the buyer’s browser. Buyers with ad blockers, buyers who declined cookies, and buyers who closed the browser before the thank-you page loaded never get tracked.
Shopify orders are recorded on the server, so none are lost. That’s why GA4 usually shows fewer purchases than Shopify has orders.
How many go missing varies by store. At one of our clients’ Shopify stores, we matched Shopify orders against GA4 purchases one by one over about six weeks, from August to mid-September 2026. 21% of orders were not in GA4. As far as GA4 knew, one in five orders never happened. August on its own came out at the same 21%, so this wasn’t a reporting delay.
Broken down by payment method:
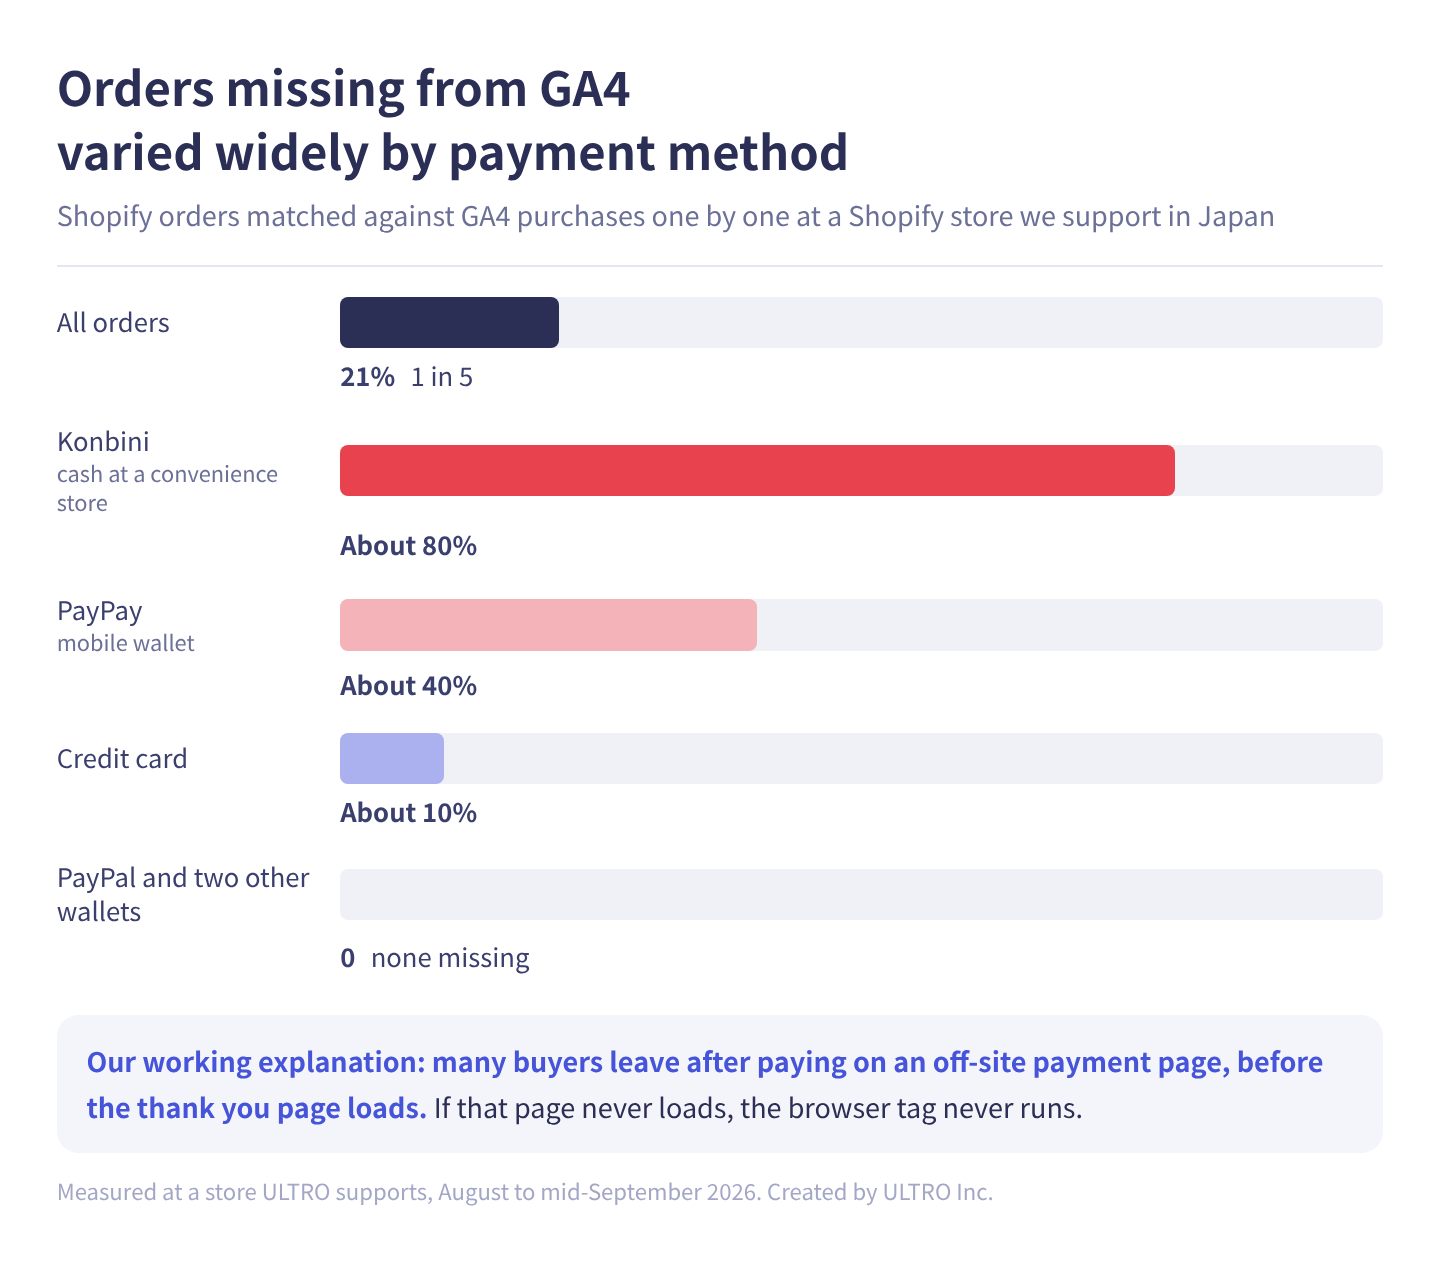
The store is in Japan, so two of these payment methods are specific to that market: konbini, where the buyer pays in cash at a convenience store, and PayPay, a mobile wallet. About 80% of konbini orders and about 40% of PayPay orders were missing from GA4, compared with about 10% of credit card orders. PayPal orders and orders from two other wallets had none missing.
Our working explanation is that many buyers finish paying on an off-site payment page and leave before returning to the store’s thank you page. If that page never loads, the browser tag never runs. We think the differences between off-site methods come down to how each provider sends the buyer back to the store after payment.
This store uses a system we built that matches Shopify orders against GA4 every day and sends only the purchases GA4 missed, server-side. Since it went in, reconciliation has shown zero missing orders. GA4 undercounting purchases is a gap you can close with the right setup.
In October 2026, we released that system as a Shopify app, GapFill. It’s our own product, so read with that in mind. It recovers missing GA4 purchase events server-side and works alongside your existing tags, and the missing purchases report is free. For how to check your own store and a comparison of three ways to close the gap, see GA4 Not Tracking All Shopify Purchases?
Our Shopify appGapFill: Recover missing GA4 purchase events server-sideWorks alongside your existing tags. Free missing purchases report.See GapFill →Shopify’s help center also lists reasons its numbers differ from Google Analytics: browser extensions that block tracking, visitors with JavaScript or cookies turned off, how bots are counted, and time zone differences.
Ad platforms can receive purchase data from your server in addition to the browser tag. See Meta Conversions API for how that works, and Cookie consent for how consent affects tracking.
Default attribution settings in each tool
| GA4 | Google Ads | Meta Ads | Shopify | |
|---|---|---|---|---|
| Default model | Data-driven | Data-driven | Counts purchases after its own ads | Last non-direct click |
| Scope | All channels | Google Ads only | Meta Ads only | All channels |
| Lookback window | 90 days | Click 30 days, engaged-view 3 days, view-through 1 day | Link click 7 days, view 1 day, engage-through 1 day | Not stated in Shopify’s help |
| View-only buyers | Generally not included | Separate column (video engaged views included) | Included | Not included |
| Date recorded | Purchase date | Click date | Purchase date | Order date |
| Modeling | Yes | Yes | Couldn’t confirm in Meta’s documentation | No |
GA4 attribution: different reports, different rules
GA4 has one more source of confusion: different reports within GA4 use different rules.
GA4 tracks traffic sources at three scopes:
| Scope | Dimension prefix | Meaning | Report |
|---|---|---|---|
| User | “First user” | Where the user came from on their first visit. Stays the same when they return | User acquisition |
| Session | “Session” | Where this visit came from | Traffic acquisition |
| Event | (none) | Which touchpoints get credit for a key event such as a purchase | Attribution reports in the Advertising section |
Take the day-6 purchase from the example.
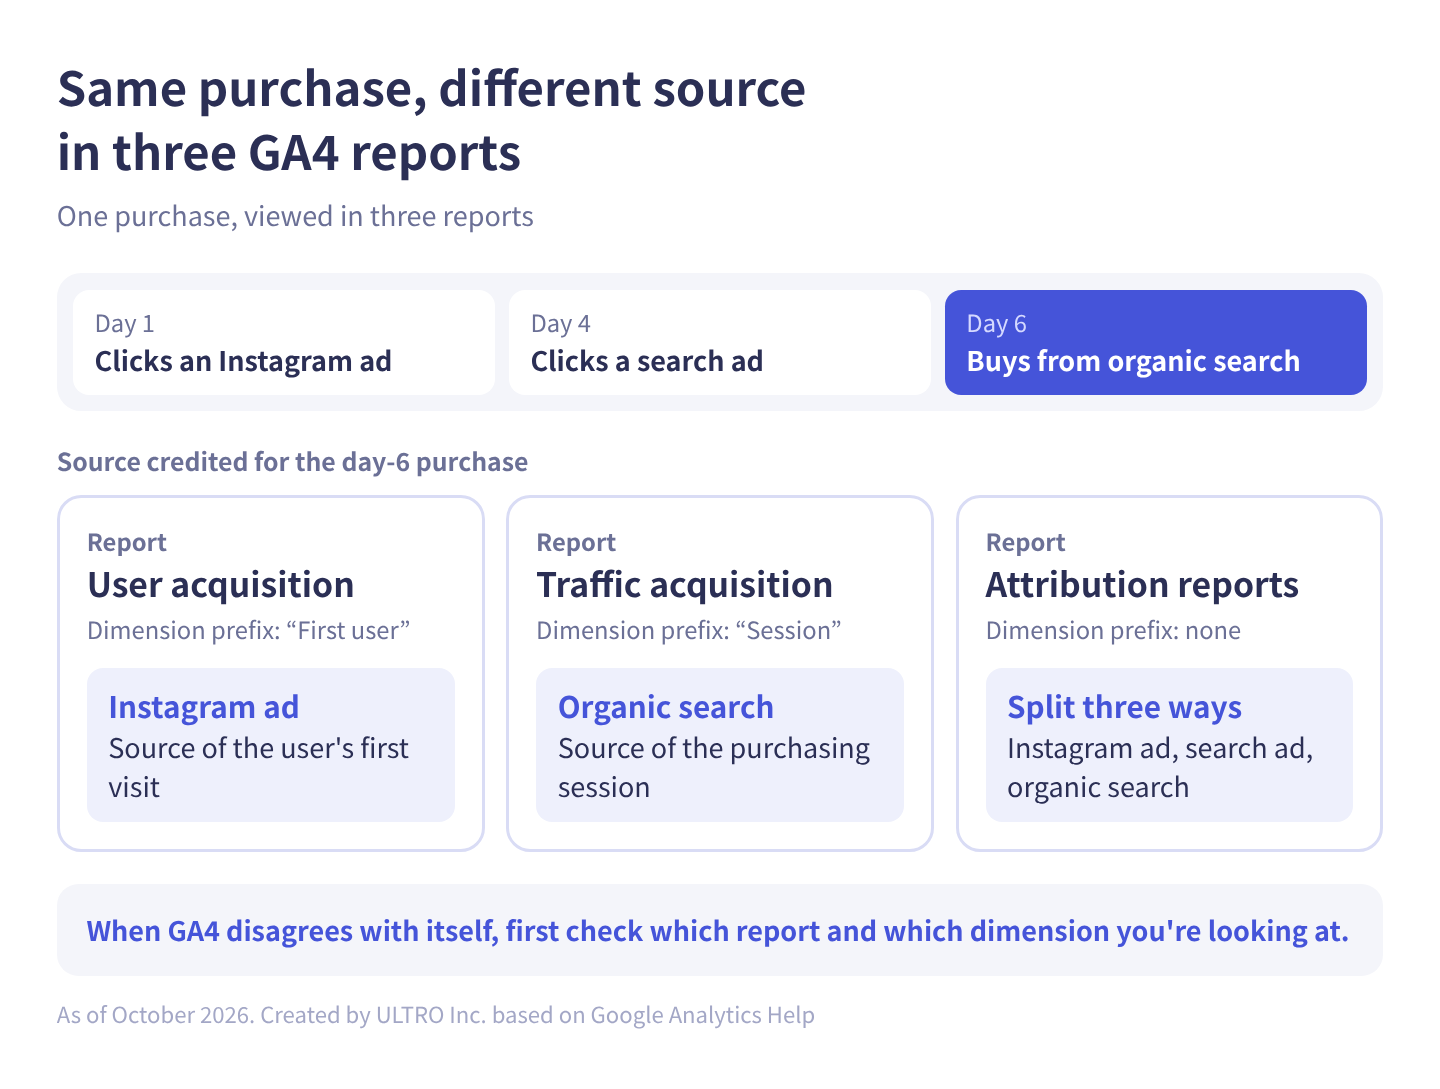
- User acquisition shows the Instagram ad (the source of the first visit)
- Traffic acquisition shows organic search (the source of the purchasing session)
- Attribution reports split credit across the Instagram ad, the search ad and organic search
The same purchase shows a different source in each. When GA4’s numbers don’t agree with each other, first check which report and which dimension you’re looking at.
If the day-6 visit had been direct (from a bookmark, say), Traffic acquisition wouldn’t show Direct; it would show the search ad, because session-scoped dimensions carry over the last non-direct source within the lookback window.
The attribution model only affects some reports
GA4’s Attribution settings, in Admin, offer three models:
| Model | How credit is assigned |
|---|---|
| Data-driven (default) | Estimates each touchpoint’s contribution and splits credit |
| Paid and organic last click | All credit to the last non-direct click |
| Google paid channels last click | All credit to the last Google Ads click |
Changing the model only affects reports that use event-scoped dimensions. User acquisition and Traffic acquisition always use paid and organic last click, regardless of the setting. That’s why the reports you look at every day don’t change when you switch models.
Direct traffic doesn’t get credit
In every GA4 model, direct visits (visits with no source) don’t receive credit. Only when the whole path is direct does Direct get the credit.
Plenty of buyers come back from a bookmark or an app and buy, so this makes sense. But visits that lost their source information along the way also become direct. If links in your emails, SMS messages or QR codes don’t carry UTM parameters, those visits are treated as direct and the credit goes to the touchpoint before them. Your email’s results end up credited to an ad. See UTM parameters for how to tag links.
Why GA4 and Google Ads differ, according to Google
Even when you import GA4 key events into Google Ads, the two won’t match. Google’s help lists these reasons:
- Different dates (Google Ads uses the click date, Analytics the date the conversion happened)
- Different counting (whether multiple purchases by the same person count every time or once)
- Google Ads filters out invalid clicks
- Different cookie lifetimes
- Imports can take up to 24 hours
For how purchases get from your store into Google Ads, see Google Ads conversion tracking.
Which number to use for which decision
You can’t make the numbers match. What you decide is which number you use for which decision.
| What you want to know | Number to use | Why |
|---|---|---|
| Revenue, orders, gross profit | Actual orders in your cart (Shopify) | Nothing is missing, and returns and cancellations can be reflected |
| Comparing channels (ads, search, email, social) | GA4 | Counts every channel by the same rules |
| Comparing within one platform (campaigns, ads, audiences) | That platform’s numbers | Conditions are consistent within the platform, and its bidding optimizes on these numbers |
| Overall ad profitability | Total ad spend vs. total store revenue | Nothing is counted twice |
What not to do
Add up platform conversions for a total. The same purchase is counted on several platforms, so the total comes out too high. ROAS calculated from that total looks better than reality.
Compare ROAS across platforms as reported. Meta includes view-only buyers and Google Ads doesn’t. Lining up numbers counted by different rules doesn’t tell you “Meta is more efficient.” To compare platforms, use GA4’s numbers.
Report revenue from GA4. GA4 purchases come out lower than actual orders. Report revenue from your cart.
Judge overall profitability from totals
However the platforms split the credit, two numbers don’t move: your total ad spend and your total store revenue.
Blended ROAS = total store revenue ÷ total ad spend
This includes revenue that didn’t come through ads, so it’s higher than any platform’s ROAS. The absolute value matters less than the trend. If this number drops sharply in a month when you raised ad spend, the extra spend may not have turned into sales. If a platform’s ROAS looks great but the blended number doesn’t move, the platform may be counting people who would have bought without the ad.
For how to read ROAS, see What Is ROAS?
What attribution can’t tell you
Attribution counts which ads a buyer touched. It can’t tell you whether they would have bought without the ad.
Ads shown to people searching for your brand name look excellent in attribution. But many of those people would have clicked the organic result right below and bought anyway. Retargeting ads are similar. To learn how much of the credited revenue the ads actually added, you need a different method.
That method is to split people who see ads from people who don’t, and compare purchases.
- Use the platforms’ tools. Google Ads and Meta Ads both offer conversion lift studies that measure the difference between a group shown ads and a group that isn’t. Both generally require working with the platform’s account team and enough volume.
- Pause and compare yourself. Pause a specific ad for a set period and watch total store revenue. Seasonality and sales affect the result, so control for them, for example by comparing with the same period last year.
- Split by region. Pause ads in some regions and compare with the rest.
For stores doing up to a few million dollars a year, the second option is the realistic one. Start with ads you suspect would have sold anyway, such as branded search and retargeting.
Analyzing historical data to estimate ad contribution, for example with regression, has the same limits:
- Ads aren’t run at random. You spend more in busy seasons and launch several things at once, so it’s hard to tell which one worked.
- Digital channels influence each other. Search ad clicks rise because of video and other ads.
- What you get is correlation, not causation.
Splitting people who see ads from people who don’t is how you get around that.
Common attribution pitfalls
Judging from the last few days. Google Ads credits the click date, so the most recent days don’t yet include people who haven’t bought. A bad-looking CPA for the last week may just mean the numbers haven’t come in. The longer your customers take to buy, the longer you need to wait.
Decimal conversions. Data-driven attribution splits one purchase across touchpoints, so you’ll see numbers like 12.4. That’s not a bug.
Changing settings mid-stream. A GA4 model change applies to past data as well; a lookback window change applies only going forward. Change settings partway through and you can’t compare before and after. Write down the date you changed them.
Mismatched time zones. If GA4, your ad accounts and Shopify use different time zones, daily numbers shift. Monthly totals roughly match, but daily ones won’t.
Returns and cancellations. Ad platforms and GA4 count at the time of purchase. Later returns or cancellations usually don’t reduce their numbers, so the gap with store revenue widens for products with high return rates.
Sources
- [GA4] Get started with attribution (Google Analytics Help)
- [GA4] Select attribution settings (Google Analytics Help)
- User acquisition and Traffic acquisition reports (Google Analytics Help)
- Scopes of traffic-source dimensions (Google Analytics Help)
- [GA4] About modeled key events (Google Analytics Help)
- Create conversions from Google Analytics events in Google Ads (Google Ads Help)
- About attribution models (Google Ads Help)
- About conversion windows (Google Ads Help)
- About conversion tracking data (Google Ads Help)
- About Conversion Lift (Google Ads Help)
- Ads Insights API Metric Availability Updates (Meta for Developers)
- Insights API (Meta for Developers)
- About attribution models and attribution settings (Meta Business Help Center)
- Set up engage-through in Meta Ads Manager (Meta Business Help Center)
- Meta introduces click and engage-through attribution updates (Search Engine Land)
- Marketing reports (Shopify Help Center)
- Analytics discrepancies (Shopify Help Center)
FAQ
What is marketing attribution?
It's deciding how much credit each ad or channel a customer touched before buying gets for that sale. A buyer might see an ad, search for the product later, then buy from an email on another day. The rule that decides whether the last touchpoint gets all the credit or the credit is split across several is called an attribution model.
Why don't GA4 and Google Ads show the same number of conversions?
They count with different rules. The main differences are which touchpoint gets credit, how far back touchpoints count, whether people who only saw an ad are included, and whether a conversion is recorded on the click date or the purchase date. Both also fill gaps with modeled data, and each can track different things. The numbers won't match even when everything is set up correctly.
My ad platforms' conversions add up to more than my actual orders. Is one of them wrong?
No. If someone clicks a Meta ad, later clicks a Google ad and then buys, Meta counts one purchase and Google Ads counts one purchase. Each platform counts purchases that followed its own ads as its own results. Platform numbers aren't meant to be added together; they're for comparing ads within that platform.
Which attribution model should I use in GA4?
Leaving the default, data-driven, is fine. GA4 offers three models: data-driven, paid and organic last click, and Google paid channels last click. First click, linear, time decay and position-based were removed in November 2023. Changing the model only affects some reports; Traffic acquisition and User acquisition don't change.
So which number should I trust?
It depends on the job. For revenue and order counts, use the actual orders in Shopify or your cart. To compare channels, use GA4, which counts every channel by the same rules. To compare ads or campaigns within one platform, use that platform's numbers. For overall profitability, look at total ad spend against total store revenue.
What's the difference between last click and data-driven attribution?
Last click gives all the credit to the last touchpoint clicked before the purchase. Data-driven compares paths that led to a purchase with paths that didn't, estimates how much each touchpoint contributed, and splits the credit. One purchase might be split as 0.6 to a search ad and 0.4 to a social ad, which is why conversion counts can have decimals.
- Attribution is the set of rules that decides which of several touchpoints gets credit for a purchase.
- GA4, Google Ads, Meta Ads and Shopify differ in model, lookback window, view-through handling and the date a conversion is recorded on.
- Each ad platform counts purchases after its own ads as its own results, so the totals add up to more than your actual orders.
- GA4 uses different rules in different reports, so the same purchase can show different sources.
- Use cart orders for revenue, GA4 for comparing channels, and each platform's numbers for comparing ads within it.
- Attribution can't tell you whether an ad actually increased sales. Test that by pausing ads or holding out a group and comparing.
Written byRyushi Nagata
CEO, ULTRO Inc. (Tokyo)Shopify Partner. Ryushi handles Shopify store builds, maintenance, advertising and CRM end to end, and has managed more than ¥4 billion in ad spend over his career. He holds Google Ads certifications (Search, Display, Video, Shopping, Apps, Performance Max, Measurement) and the Google Analytics certification.
How many purchases is GA4 missing in your store?
GapFill matches your Shopify orders against GA4 purchases, shows what GA4 missed, and recovers those purchase events server-side. It works alongside your existing tags, and the missing purchases report is free.