What Is ROAS? Formula, Break-Even ROAS and How to Set a Target

The ROAS formula and how to write it, how it differs from CPA and ROI, how to work back from your gross margin to a target ROAS, and when to set separate targets by product.
ROAS shows up in every ad report, but ask “what ROAS should we aim for?” and every article gives a different answer. That’s because what counts as a good ROAS depends on your gross margin. An average borrowed from elsewhere won’t tell you anything about your own store.
Below: the ROAS formula and how to write it, how it differs from CPA and ROI, how to work out a target ROAS from your own numbers, and where ROAS commonly misleads online stores. Ad platform names are as of October 2026.
What is ROAS? Formula and meaning
ROAS stands for return on ad spend. It shows how much revenue your ads brought back for what you spent on them.
ROAS = revenue from ads ÷ ad spend
Multiply by 100 for a percentage.
| Ad spend | Revenue from ads | ROAS (x) | ROAS (%) |
|---|---|---|---|
| $5,000 | $15,000 | 3.0 | 300% |
| $5,000 | $5,000 | 1.0 | 100% |
| $5,000 | $2,500 | 0.5 | 50% |
Neither form is more correct. You’ll see 3x, 3:1 and 300%, and they all mean the same thing. State the unit whenever you share a target, and you’ll avoid confusion.
ROAS in Google Ads and Meta Ads
Google Ads doesn’t have a column called ROAS. The equivalent is Conv. value / cost, which you add from the Conversions group in the Columns menu. It’s a ratio: Google’s help says to multiply it by 100 to get a Target ROAS percentage. If your account doesn’t send conversion values (the purchase amount), this column is empty.
The bid strategy is called Target ROAS, and you set it as a percentage. (Starting in June 2026, Google began relabeling it from “Maximize conversion value with a Target ROAS”; bidding behavior is unchanged, and some accounts may still show the old label.) In Meta Ads Manager, the equivalent metric is Purchase ROAS (also shown as Website purchase ROAS).
Either way, ROAS only works if your conversions carry a value. If yours don’t, start by fixing your conversion tracking. See Google Ads conversion tracking for Google Ads.
ROAS 100% is not break-even
This is the most common misunderstanding. A ROAS of 100% only means ad spend and revenue from ads are equal. Revenue includes the cost of the goods, so at that point you’re already losing money.
Here’s what happens when you spend $5,000 on ads for a product with a 40% gross margin.
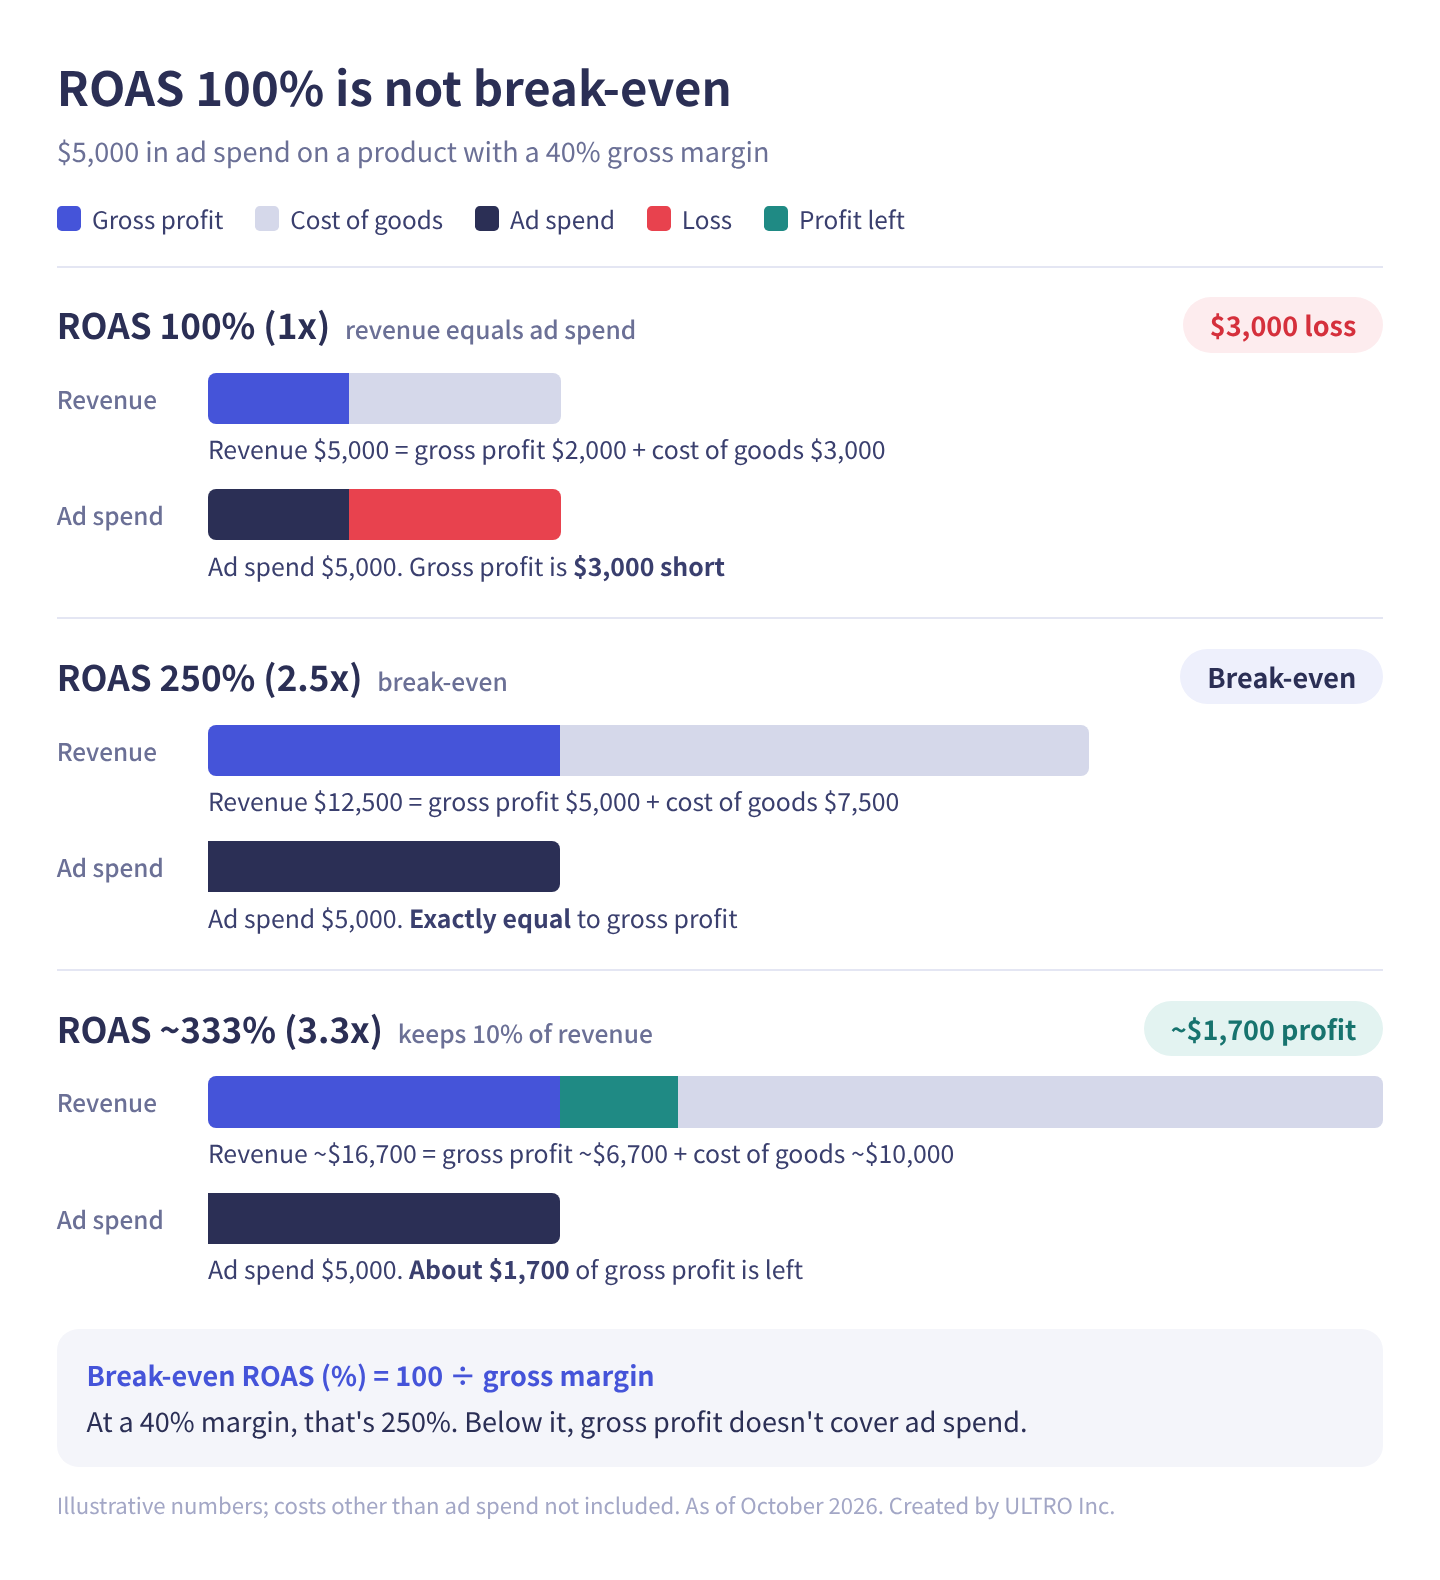
To think in profit, bring in gross margin. Ignoring costs other than advertising, the point where ad spend is exactly covered is break-even ROAS.
Break-even ROAS (%) = 100 ÷ gross margin
| Gross margin | Break-even ROAS | Target ROAS to keep 10% of revenue as profit |
|---|---|---|
| 20% | 500% | 1,000% |
| 30% | ~333% | 500% |
| 40% | 250% | ~333% |
| 50% | 200% | 250% |
| 60% | ~167% | 200% |
| 70% | ~143% | ~167% |
The right column uses 100 ÷ (gross margin − 10%). The thinner your margin, the faster the required ROAS climbs. Set a 300% target on a product with a 20% margin, and you lose money the moment you hit it.
Calculate gross margin carefully for ecommerce
If you calculate gross margin as (price − cost of goods) ÷ price, an online store has more to subtract:
- Shipping (whatever you absorb with free shipping)
- Payment processing fees
- Packaging and inserts
- Marketplace or platform transaction fees
- Expected returns and cancellations
If you don’t use the real margin after these costs, you’ll underestimate break-even ROAS. For products where many orders fall below your free shipping threshold, the real number is a lot tighter than it feels.
Enter your price, cost of goods and per-order costs to get your real gross margin. The defaults are an $80 price, $36 cost of goods, $8 for shipping and packaging, and a 5% fee. On cost of goods alone, the margin is 55%, but after costs it’s down to 40%.
The calculation runs only in your browser; nothing you enter is sent anywhere. Expected returns and cancellations aren't included. If they're significant for your products, add them to shipping and packaging.
The formula is: real gross margin = (price − cost of goods − shipping and packaging − price × fee rate) ÷ price. The break-even ROAS row shows the value from cost of goods alone next to the value from your real margin. With the defaults, that’s 182% versus 250%. Looking at cost of goods alone, you’d think a 200% ROAS was profitable.
How to set a target ROAS
There are four steps:
- Work out gross profit per order, using the real margin after the costs above
- Work out break-even ROAS: 100 ÷ gross margin
- Add the profit you want to keep: decide what share of revenue you want left as profit, then calculate 100 ÷ (gross margin − target profit margin)
- Set a max CPA, because a dollar amount is often easier to work with day to day
The formula for step 4:
Max CPA = average order value ÷ target ROAS (x)
With an $80 average order value and a 250% (2.5x) target ROAS, your max CPA is $32. When you hand bidding or pause decisions to someone else, “up to $32 per order” is clearer than a ROAS.
Target ROAS and max CPA calculator
Enter your gross margin and the share of revenue you want to keep as profit to get break-even and target ROAS. Add your average order value to also get your max CPA (what you can spend per order at the target) and break-even CPA (above this, you lose money). The defaults are a 40% margin, 10% profit and an $80 average order value.
The calculation runs only in your browser; nothing you enter is sent anywhere. Fold costs other than advertising into your gross margin.
The formulas match the steps above: break-even ROAS = 100 ÷ gross margin, target ROAS = 100 ÷ (gross margin − profit share), max CPA = average order value ÷ target ROAS (x). Use your real margin after shipping and payment fees, which you can get from the calculator above.
If order values vary widely, bid on ROAS, not CPA
A max CPA only works when order values are fairly consistent. If a $30 single item and a $500 bundle sit in the same campaign, a single CPA cap doesn’t fit either. $32 per order is too loose for the $30 order, letting through unprofitable sales, and too strict for the $500 order, holding back delivery.
Here’s a $32 max CPA compared with a 250% target ROAS for those two orders.
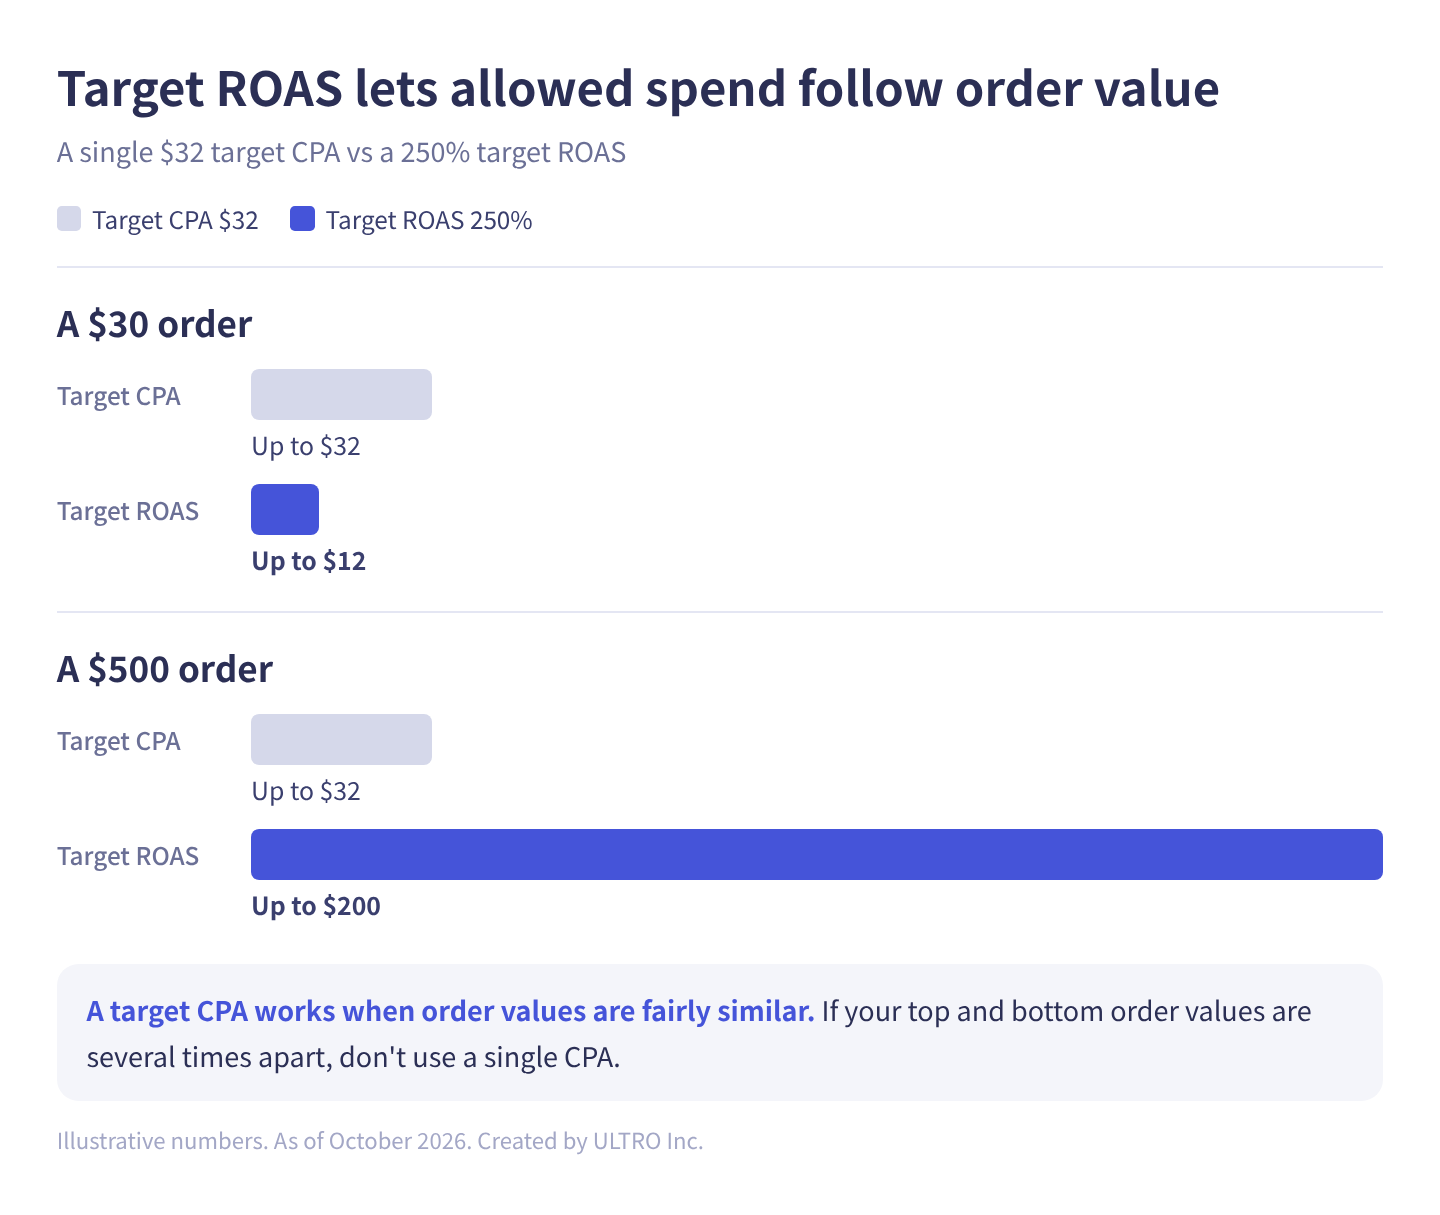
With a target ROAS, the acquisition cost you can accept moves with the order value. At 250%, a $500 order can take up to $200 in ad spend, and a $30 order up to $12.
There’s no fixed threshold for “varies widely.” Look at the distribution of order values in your order data. If your top and bottom orders are several times apart, it’s safer not to use a single CPA.
If margins or LTV differ by product, set targets by product
There’s one more level. If margins or post-purchase lifetime value differ between products, a single site-wide target doesn’t hold up.
- A product with a 60% margin breaks even at about 167% ROAS; one with a 20% margin at 500%, three times higher
- An entry product that leads to subscriptions can accept a lower first-order ROAS than a product people buy once
One site-wide target means you under-invest in high-margin products and lose money on low-margin ones. Both are missed opportunities.
In that case, set target KPIs by product (or category), and split campaigns or ad groups accordingly. To see which products work as entry points, filter Shopify’s customer cohort analysis by first-purchased product.
This adds management work, so don’t try to split every product at once. Grouping products with similar margins into two or three groups is a workable start.
Targets set this way have a better basis than industry averages. Published ROAS benchmarks by industry mix different margins and tracking setups (what counts as a conversion, which attribution window), so they can’t tell you what a good ROAS is for your store. They’re fine as a reference, but don’t make them your target. ROAS is a metric for comparison; there’s no single “right” value.
ROAS vs CPA vs ROI
| Metric | Formula | Unit | Best for |
|---|---|---|---|
| ROAS | Revenue from ads ÷ ad spend | x or % | Products where order value or basket size varies |
| CPA | Ad spend ÷ conversions | $ | Fixed-price products, lead generation |
| ROI | Profit ÷ investment | x or % | Judging whether an effort as a whole made money |
ROAS and CPA look at the same thing from different angles. ROAS (x) = average order value ÷ CPA, so setting one determines the other. ROAS is easier for products ranging from $30 to $300; CPA is easier when the price is fixed, like the first order of a subscription.
ROAS and ROI differ in whether the numerator is revenue or profit. ROAS is based on revenue, so it ignores gross profit, which is exactly where the “ROAS 100% means break-even” misunderstanding comes from. If you can calculate ROI, it’s closer to what you need for decisions. A related metric, POAS (profit on ad spend), divides gross profit by ad spend.
To see the whole account across platforms, divide total store revenue by total ad spend. Each platform’s ROAS is self-reported by its own rules, so adding platforms together doesn’t give you the total. Total revenue ÷ total ad spend is called blended ROAS, and the same idea is sometimes called MER (marketing efficiency ratio). For why platform numbers don’t add up, see Marketing attribution.
For repeat purchases, don’t stop at first-order ROAS
For subscriptions and consumables that people buy again, judging ROAS on the first order alone can make you cut ads that are worth scaling.
The idea is to discount break-even ROAS by an LTV multiple:
Acceptable first-order ROAS (%) = break-even ROAS ÷ LTV multiple
The LTV multiple is revenue per customer over a set period ÷ first-order revenue. With a 200% break-even ROAS and an LTV multiple of 2.0, a first-order ROAS of 100% pays back.
Two cautions. First, you’re out the cash for the whole payback period. Second, the LTV multiple comes from past customers, and there’s no guarantee newly acquired customers will buy the same way. In our experience, right after you change your acquisition sources, it’s safer to assume the multiple may change too (we don’t have hard evidence on this).
It’s also safer not to use a single LTV multiple for everything. Calculate it by ad platform, message and offer. Looking at one blended number hides a losing channel propped up by others. First-order discounts tend to lower LTV, too: if you apply the multiple from full-price customers to customers acquired with a discount, you’ll overestimate the first-order ROAS you can accept.
Break ROAS down to see where to act
ROAS breaks down into three numbers:
ROAS (x) = average order value × conversion rate ÷ CPC
With a $0.60 CPC, 1.5% conversion rate and $80 average order value, that’s 80 × 0.015 ÷ 0.60 = 2.0x (200%). There are three ways to get from there to 2.4x (240%).
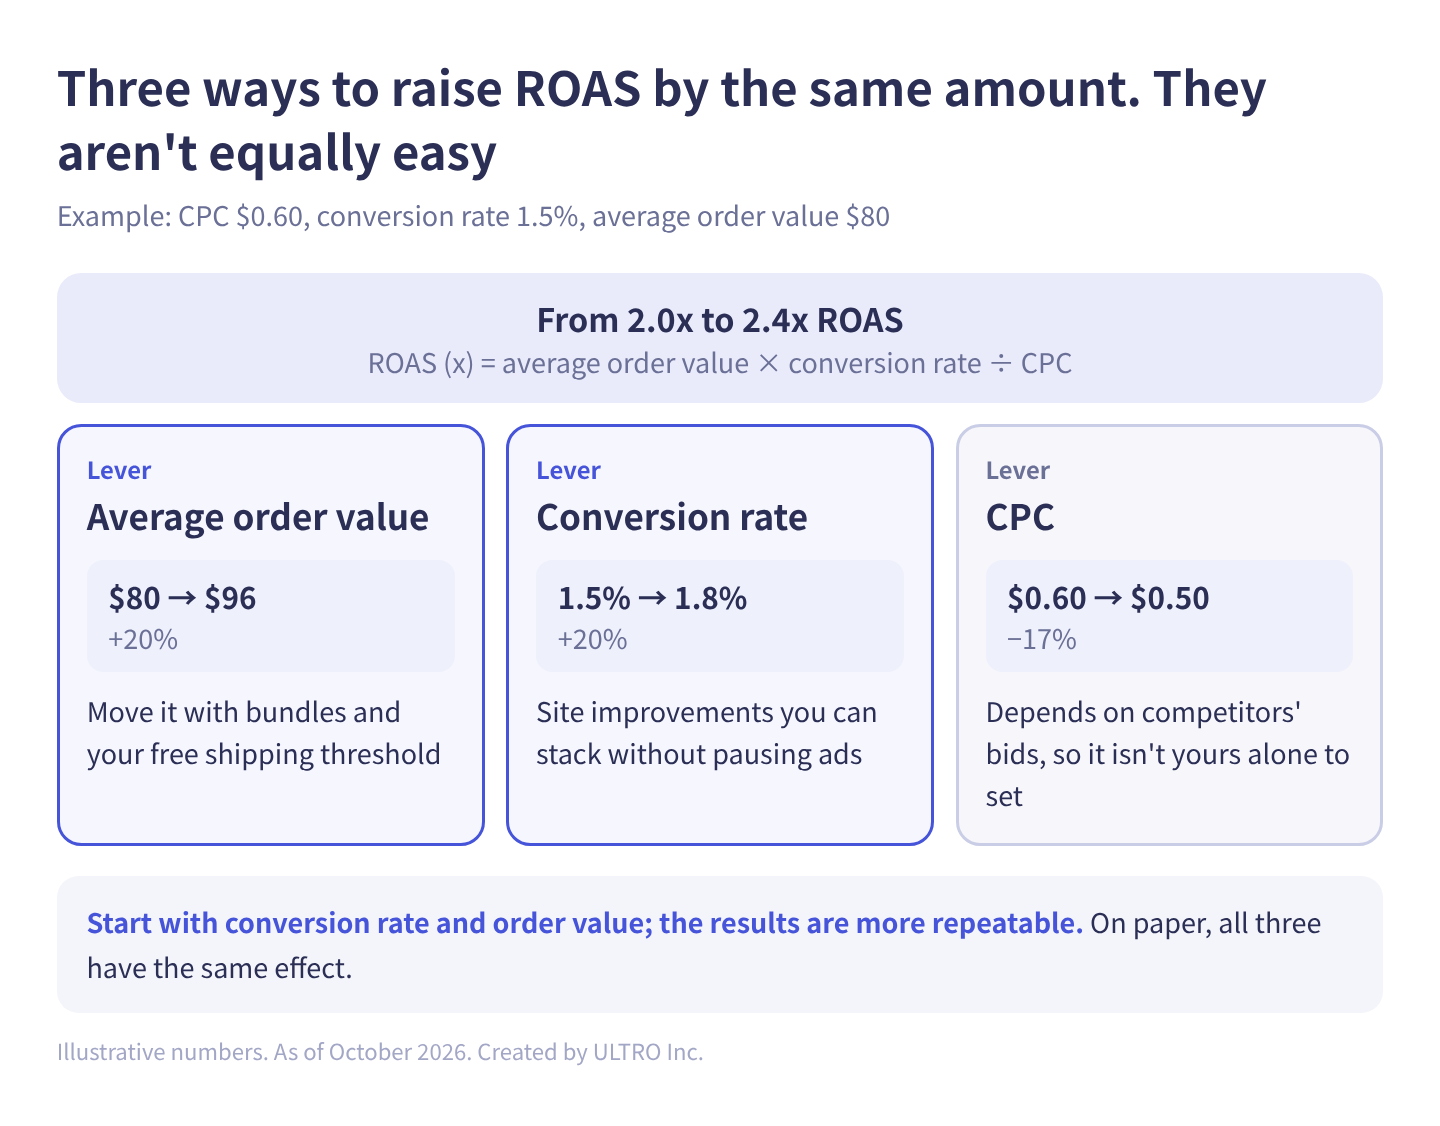
As a table:
| Lever | Change | Resulting ROAS |
|---|---|---|
| Average order value | $80 → $96 (+20%) | 2.4x |
| Conversion rate | 1.5% → 1.8% (+20%) | 2.4x |
| CPC | $0.60 → $0.50 (−17%) | 2.4x |
On paper they have the same effect, but they’re not equally easy to move. CPC depends on competitors’ bids, so it isn’t yours alone to set. Average order value responds to bundles and your free shipping threshold. Conversion rate improvements happen on your site, so you can stack them without pausing ads.
In practice, starting with conversion rate and order value gives more repeatable results. For how to read conversion rate and what to fix first, see Ecommerce conversion rate.
Common ROAS pitfalls
Platform numbers can’t be added up Attribution windows and whether view-through conversions count differ by platform. Several platforms may each claim the same purchase. To see the whole picture, use store revenue and total ad spend.
Discounts, returns and cancellations aren’t reflected If your conversion value is the order amount at checkout, later returns and cancellations aren’t subtracted. Products with high return rates show better numbers than reality.
Tax and shipping are handled inconsistently A common mismatch: your store sends conversion values that include tax and shipping, while your gross margin is calculated without them. Before setting a target, check what your conversion value includes.
Indirect effects aren’t counted Someone who sees an ad and later buys through a branded search doesn’t show up in that ad’s ROAS. Watch branded search volume and total store revenue as well.
Short periods swing wildly One large order can make ROAS jump. Make decisions over a period with enough conversions.
ROAS in GA4 comes out low by however many purchases GA4 missed GA4 records a purchase only when the tag runs in the buyer’s browser. Orders where the thank you page never loaded, among others, don’t make it in, so ROAS based on GA4 revenue is lower than reality. In one of our clients’ Shopify stores, 21% of orders were missing from GA4. To compare with your Shopify orders and find the gap, see GA4 Not Tracking All Shopify Purchases? We built a Shopify app for this, GapFill. It’s our own product, so read with that in mind. It recovers missing GA4 purchase events server-side and works alongside your existing tags, and the missing purchases report is free.
Our Shopify appGapFill: Recover missing GA4 purchase events server-sideWorks alongside your existing tags. Free missing purchases report.See GapFill →All of these come back to the same point: platform ROAS alone can’t tell you whether an ad actually increased sales. For how to test that, see Marketing attribution.
Sources
FAQ
What is ROAS?
ROAS stands for return on ad spend. It's revenue from ads divided by ad spend, so it tells you how many dollars of revenue each dollar of advertising brought back.
What is the ROAS formula?
ROAS = revenue from ads ÷ ad spend. Multiply by 100 for a percentage. $5,000 in ad spend that brings in $15,000 in revenue is a ROAS of 3, written as 3x, 3:1 or 300%.
Should ROAS be written as a percentage or a ratio?
Both are common. Google Ads takes a target ROAS as a percentage, while many reports and conversations use a ratio such as 3x or 3:1. What matters is not mixing them in one document and stating the unit whenever you share a target.
If my ROAS is 100%, am I at least breaking even?
No, you're losing money. A ROAS of 100% means revenue equals ad spend, before cost of goods, shipping or anything else. On a product with a 50% gross margin, you need 200% just to cover ad spend.
What is a good ROAS?
There's no universal number, because it depends on your gross margin. Start with break-even ROAS (100 ÷ gross margin), then add the profit you want to keep to get your own target. Industry averages mix different margins and tracking setups, so they don't work as a target.
Should I use ROAS or CPA?
ROAS suits products whose order values vary; CPA suits products with a fixed price. Since ROAS (x) = average order value ÷ CPA, setting one determines the other. If order values vary widely on your site, a target ROAS is easier to work with than a single CPA cap.
Should I set target ROAS by product?
Yes, if margins or lifetime value differ a lot between products. A product with a 60% margin breaks even at about 167% ROAS, one with a 20% margin at 500%, three times higher. One site-wide target means you under-invest in high-margin products and lose money on low-margin ones. Start by grouping products with similar margins into two or three groups, with separate campaigns.
- ROAS = revenue from ads ÷ ad spend. Multiply by 100 for a percentage.
- ROAS 100% isn't break-even. Break-even ROAS (%) = 100 ÷ gross margin, so a 50% margin breaks even at 200%.
- Work out target ROAS from your gross margin and the profit you want to keep, not from industry averages. Max CPA = average order value ÷ target ROAS (x).
- Breaking ROAS (x) into average order value × conversion rate ÷ CPC shows where to act.
- If order values vary widely, bid on ROAS rather than CPA. If margins or LTV differ by product, set targets by product.
- For repeat-purchase products, don't stop at first-order ROAS. Platform ROAS can't be added up, so judge the whole account from store revenue and total ad spend.
Written byRyushi Nagata
CEO, ULTRO Inc. (Tokyo)Shopify Partner. Ryushi handles Shopify store builds, maintenance, advertising and CRM end to end, and has managed more than ¥4 billion in ad spend over his career. He holds Google Ads certifications (Search, Display, Video, Shopping, Apps, Performance Max, Measurement) and the Google Analytics certification.
How many purchases is GA4 missing in your store?
GapFill matches your Shopify orders against GA4 purchases, shows what GA4 missed, and recovers those purchase events server-side. It works alongside your existing tags, and the missing purchases report is free.