Average Ecommerce Conversion Rate: 2026 Shopify Benchmarks

The median Shopify store converts 1.4% of sessions. But industries differ by 3x, and Shopify and GA4 won't agree. How to line up the definitions, split the path to purchase into stages, and fix the weakest stage first.
“Is our conversion rate low compared to the average?” and “What should we fix first?” are two of the questions we hear most from Shopify merchants.
The short answer: the median Shopify store converts 1.4% of sessions (Littledata, 427 stores, July to October 2026). But industry medians range from 0.9% to 2.8%, and the same store shows a different conversion rate in the Shopify admin, in GA4 and in its ad accounts. Before comparing against any average, you need to know which number you’re looking at and how it’s defined.
Then there’s the bigger issue: conversion rate drops for different reasons on different stores. A store losing people on product pages and a store losing them at checkout need completely different fixes.
We’ll cover:
- The formula, and Shopify conversion rate benchmarks by percentile, device and industry
- Where to find conversion rate in Shopify, and why GA4 and ad platforms disagree
- How to split the path to purchase into five stages and find where people drop off
- Fixes for each stage, and the order to tackle them in
Benchmarks are as of October 2026.
How to calculate ecommerce conversion rate
Ecommerce conversion rate is purchases divided by sessions:
Conversion rate (%) = purchases ÷ sessions × 100
Shopify’s and Littledata’s numbers are “the share of sessions with at least one purchase,” so a session with two orders counts once. To get close to that in GA4, mark purchase as a key event, open Reports > Acquisition > Traffic acquisition, and look at Session key event rate with the key event set to purchase. (Depending on your property’s report collections, Traffic acquisition may sit under Business objectives > Generate leads instead.) Dividing Ecommerce purchases by Sessions also works, but it counts orders rather than sessions with an order, so it runs slightly high if people often buy more than once per session.
The denominator changes the number dramatically:
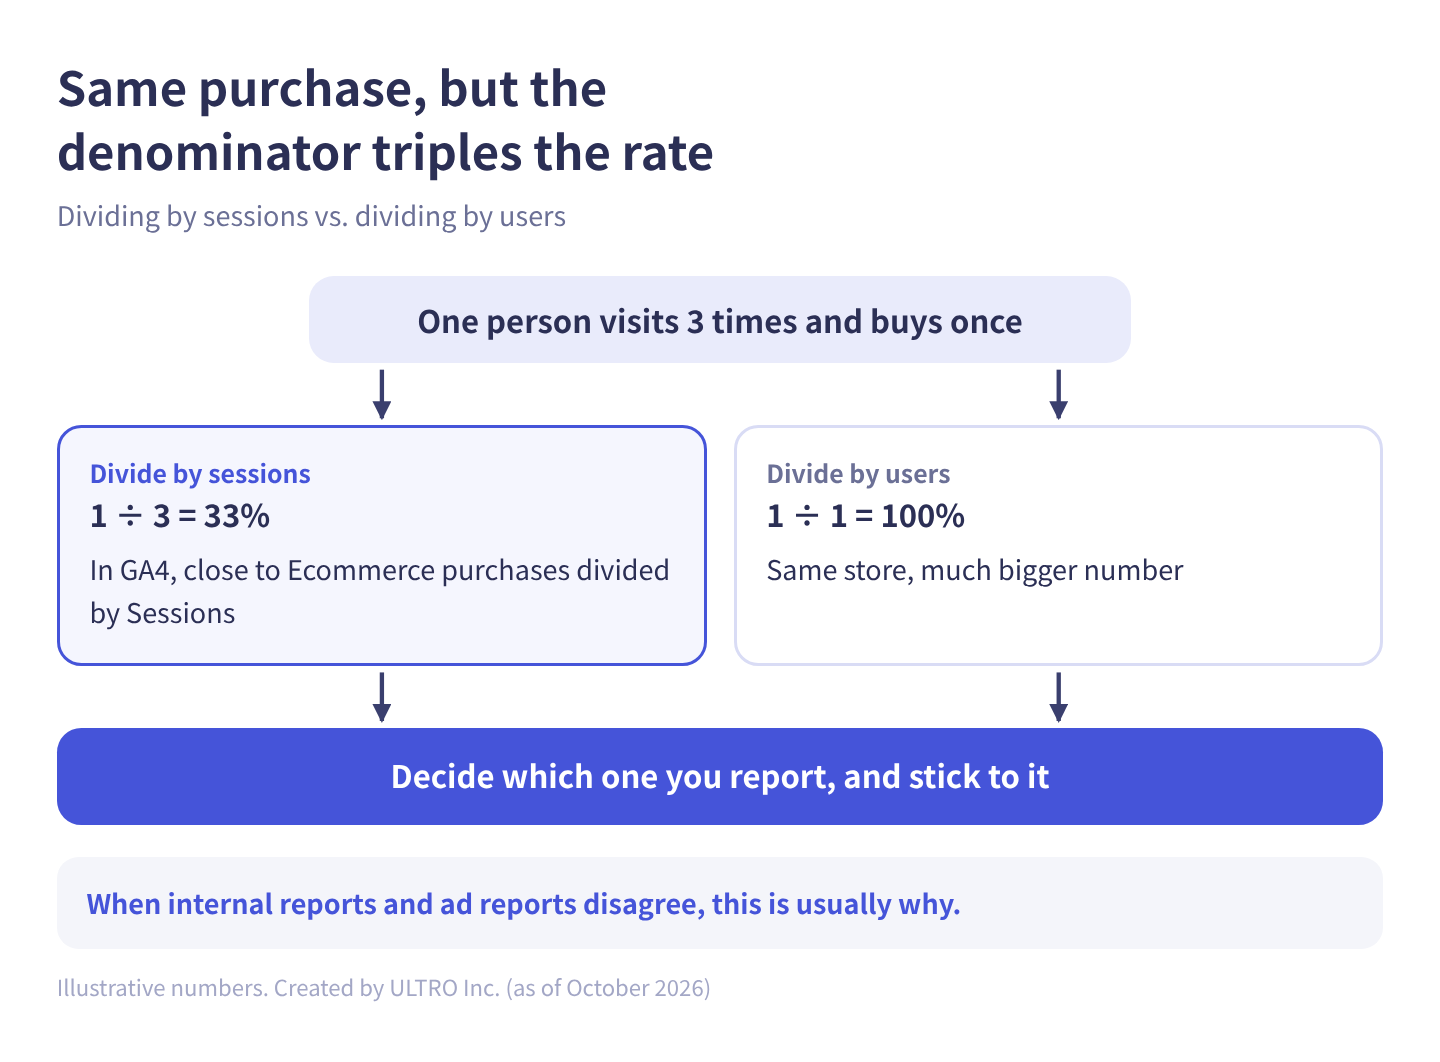
If one person visits three times and buys once, the session-based rate is 33% and the user-based rate is 100%. When an internal deck and an ad report disagree, this is usually why. Decide which one you report, and stick to it.
For an online store, it also pays to split conversion rate three ways:
- By device: mobile and desktop can have similar conversion rates but very different add-to-cart and checkout rates
- By traffic source: an average that mixes branded search with display ads tells you nothing
- New vs. returning: a higher share of returning customers lifts conversion rate without any site change
For the difference between sessions and users in GA4, see GA4 users vs. sessions.
Average Shopify conversion rate: 1.4% median
The median Shopify store converts 1.4% of sessions, and the top 20% start at 2.6%. These numbers come from Littledata, which makes an app that sends Shopify data to GA4, and cover 427 stores using it (GA4 data for the 90 days from July 13 to October 10, 2026, calculated October 14). Littledata computes “sessions with a purchase ÷ all sessions” for each store, then ranks the stores.
| Percentile | Conversion rate |
|---|---|
| Top 10% | 3.6% and above |
| Top 20% | 2.6% and above |
| Median | 1.4% |
| Mean | 1.9% |
| Bottom 20% | 0.5% and below |
The mean (1.9%) is above the median because a handful of stores pull it up. Compare yourself against the median.
Funnel rates and mobile vs. desktop
There are benchmarks for the stages before purchase too. From Littledata’s companion benchmarks for the same period (424–426 stores):
| Metric | All | Mobile | Desktop |
|---|---|---|---|
| Conversion rate (purchases ÷ sessions) | 1.4% | 1.5% | 1.5% |
| Add-to-cart rate (sessions with an add to cart ÷ sessions) | 6.7% | 5.4% | 9.7% |
| Checkout completion rate (purchases ÷ sessions that began checkout) | 52% | 62% | 39% |
Median conversion rate is the same on mobile and desktop, but the path is different. Mobile shoppers add to cart less often but finish checkout more often once they start; desktop is the reverse. Our reading is that one-tap payment methods like Shop Pay and Apple Pay carry mobile shoppers through checkout, while comparing products is easier on desktop. (The benchmark itself doesn’t tell you why.)
Put your own numbers next to this table and you’ll have a first guess at your weak stage. An add-to-cart rate well below 6.7% points at product pages; a checkout completion rate well below 52% points at checkout.
Caveats when using benchmarks
These numbers have limits:
- They cover stores that use Littledata, and the countries aren’t stated.
- They’re built from sessions and purchases recorded in GA4, so the definition differs slightly from the conversion rate in the Shopify admin (more on that below).
- Littledata records purchases, add-to-carts and checkouts server-side from Shopify and sends them to GA4, so it counts what ad blockers and browser privacy features would hide. That likely makes the benchmark higher than what a store with browser-only GA4 tags would see.
- They’re a trailing 90 days and change with each recalculation. Cite them with the date.
Other “averages” you’ll find online mix in user-based denominators and old data. A user-based rate is always higher than a session-based one for the same store, so check the denominator before comparing.
Use your own history as the baseline
Benchmarks tell you roughly where you stand, but they’re too coarse to be a target. Base your target on your own last 12 months. To set one:
- Pull conversion rate by month for the last 12 months to see the seasonal range
- Split by traffic source and use your largest source as the baseline
- Treat that source’s best month as a realistic ceiling
- Work back from the target rate to the revenue it would add
Cart abandonment is one number that’s well documented. Baymard Institute’s average across 50 studies is 70.22% (studies from 2006 to 2025; page last updated September 22, 2025). It’s reasonable to plan on 7 in 10 people who add to cart not buying.
Ecommerce conversion rate by industry
Industry medians for Shopify stores range from 0.9% to 2.8%. Splitting the same Littledata data by industry (store counts in parentheses):
| Industry | Median conversion rate |
|---|---|
| Beauty & skincare | 2.8% (38 stores) |
| Health & supplements | 2.4% (34 stores) |
| Food & beverage | 2.3% (31 stores) |
| Fashion & apparel | 1.2% (75 stores) |
| Home & furniture | 0.9% (62 stores) |
Beauty converts three times as well as furniture. A furniture store at 1.2% is above its industry median; a beauty store at 1.2% is well below. Comparing against a cross-industry “ecommerce average” will mislead you.
Where to find conversion rate in Shopify
In Shopify, conversion rate is under Analytics > Reports, filtered to the Behavior category:
- In the Shopify admin, go to Analytics > Reports
- Click the Category filter and select Behavior
- Open Conversion rate over time for the daily, weekly or monthly trend, and Conversion rate breakdown for counts at each step
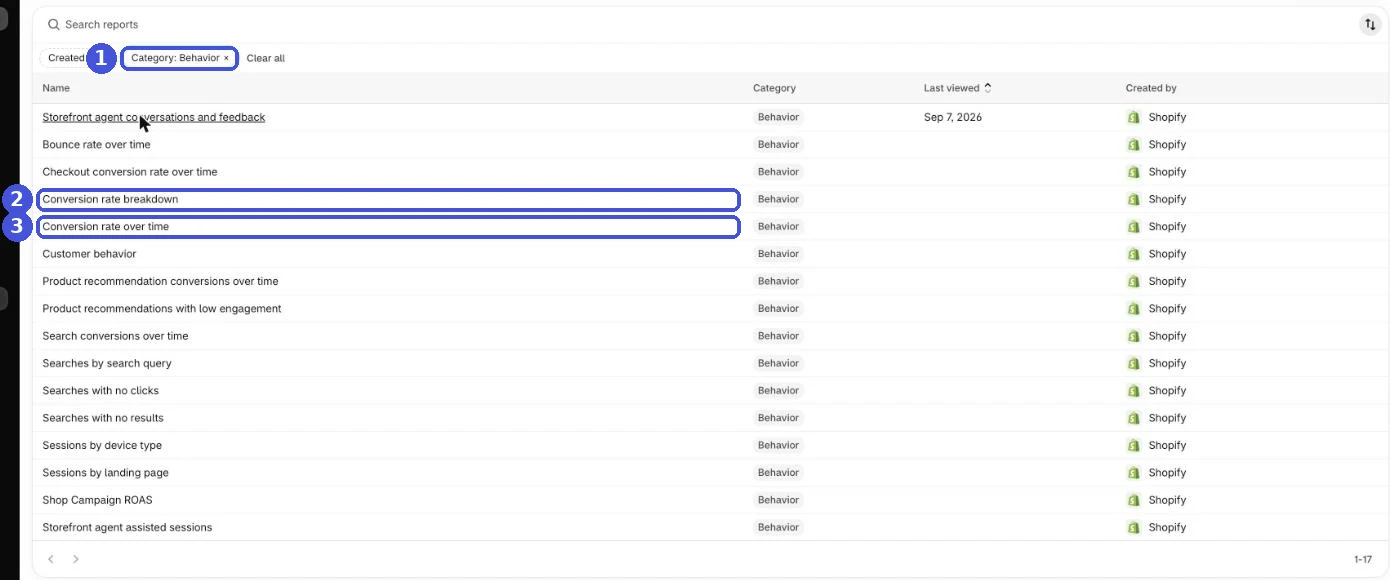
The same reports are available in the Shopify mobile app. Sessions by device and Sessions by landing page, in the same category, help when you split conversion rate.
How Shopify defines it
Shopify’s help center defines the metrics like this:
| Metric | Shopify’s definition |
|---|---|
| Conversion rate | The percentage of sessions that resulted in a purchase |
| Sessions with cart additions | The total number of sessions where a customer added a product to a cart |
| Sessions that reached checkout | The total number of sessions where there was user input (for example, a key press or mouse click) during checkout |
Conversion rate breakdown has four steps: all sessions, sessions with cart additions, sessions that reached checkout, and sessions that completed checkout. Compared with the five stages you’d build in GA4, it has no product page step. Also, opening the checkout page alone doesn’t count as reaching checkout; there has to be input. That’s different from GA4’s begin_checkout.
The breakdown has an Open Funnel toggle. An open funnel includes sessions that enter at any step and do steps in any order; a closed funnel includes only sessions that complete every step in sequence. We use the closed funnel when looking at drop-off between stages, because sessions that skipped a step don’t get mixed in and the pass-through rates read cleanly.
Shopify changed how it counts sessions on September 21, 2026
Between September 21 and 23, 2026, Shopify updated how its analytics measures sessions. The main changes in the help center:
- A session ends after 30 minutes of inactivity. It used to also break at midnight UTC; activity that continues past midnight now counts as one session
- Sessions identified as bots are filtered out of session-related reports by default (bot classification applies to sessions from October 7, 2025 onward)
- Some sessions with no pageview, such as going straight to checkout from a cart link, are now counted
Affected metrics include sessions, conversion rate, bounce rate, online store visitors and other session-based rates. Orders, sales and customer counts aren’t affected. Shopify recommends treating post-update data as the new baseline for session-based metrics.
So if conversion rate jumped or dropped in late September, it may not be your store. Before comparing with last year or with August, check whether the comparison crosses this change.
Why Shopify, GA4 and ad platforms report different conversion rates
Shopify, GA4 and your ad accounts disagree because each counts the numerator and denominator differently. It doesn’t mean one of them is broken.
| Where | Denominator | Numerator | Main reason it differs |
|---|---|---|---|
| Shopify analytics | Sessions Shopify counted (bots filtered) | Sessions that completed checkout | Counting changed on September 21, 2026 |
| GA4 | Sessions where the tag ran | Sessions with a purchase event (or purchases) | Cookie refusals, ad blockers and disabled JavaScript lose both sessions and purchases |
| Google Ads | Ad interactions (clicks and so on) | Conversions attributed to ads | One interaction can count more than one conversion, so it can exceed 100% |
Shopify’s help center lists the same kinds of reasons for discrepancies with third-party tools: how sessions are defined, bots, JavaScript and cookies, browser extensions that block tracking, and time zones.
An ad platform’s conversion rate only counts people who clicked that ad, so it’s a different thing from your site-wide rate. An ad converting at 3% while the site converts at 1.4% isn’t a contradiction.
In practice, use each for what it’s good at:
- Site-wide trend: Shopify analytics, on the same screen as orders and sales
- Breakdown by source and stage: GA4, which can slice by channel and campaign
- Comparing ads: your ad platform, but never add its numbers to site-wide totals
If GA4 shows clearly fewer purchases than Shopify has orders, fix the tracking first. We cover the causes and fixes in GA4 not tracking all Shopify purchases. Our Shopify app GapFill recovers missing GA4 purchase events server-side and works alongside your existing tags, and its missing purchases report is free. It’s our own product, so read with that in mind.
Our Shopify appGapFill: Recover missing GA4 purchase events server-sideWorks alongside your existing tags. Free missing purchases report.See GapFill →Find the drop-off stage in five steps
Choose fixes only after you’ve split the path to purchase into five stages and found the weakest one:
| Stage | GA4 event | What it tells you |
|---|---|---|
| 1. Visit | session_start | Traffic volume and quality |
| 2. Product page | view_item | Whether people find and reach products |
| 3. Add to cart | add_to_cart | Whether the product page convinced them |
| 4. Begin checkout | begin_checkout | Whether they decided to move past the cart |
| 5. Purchase | purchase | Whether they could finish paying |
Look at the pass-through rate between stages. If the drop from product page to add to cart stands out, the problem is on the product page. If it’s from add to cart to begin checkout, look at how you show shipping costs and delivery times. If it’s from begin checkout to purchase, it’s the form or the payment methods.
You can’t tell these apart by staring at the overall rate. Narrow it to one stage before you pick a fix. For what each of these events means, see GA4 events.
Building the funnel in GA4
Use a funnel exploration in GA4. Funnel explorations count users who completed each step, so you can’t compare them directly with session-based benchmarks like Littledata’s. Use the rates to compare your own stages with each other and find the weakest.
- Open your property in GA4 (https://analytics.google.com/)
- Click Explore in the left menu
- Under Start a new exploration, select Funnel exploration

The template comes with a few default steps. Replace them with the five ecommerce stages:
- In the Settings panel, click the pencil icon next to Steps
- Set each step’s event to session_start, view_item, add_to_cart, begin_checkout and purchase (the screenshots below show the four steps from view_item; session_start adds the visit stage)
- Click Apply
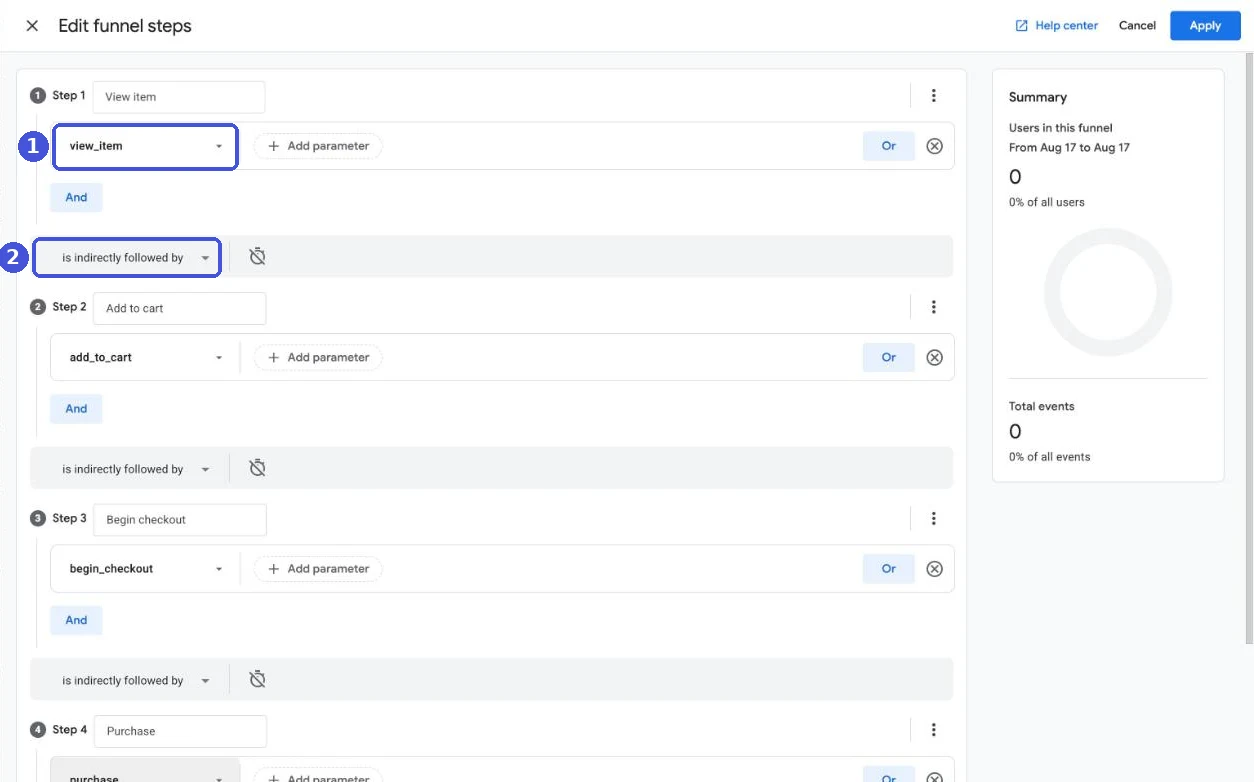
“Is indirectly followed by” means a step still counts if other events happen in between; “is directly followed by” requires it to come immediately after.
- Add Device category under Breakdown to split mobile and desktop
- Turn on Show elapsed time to see the average time between steps
You now have completion and abandonment rates for each step.
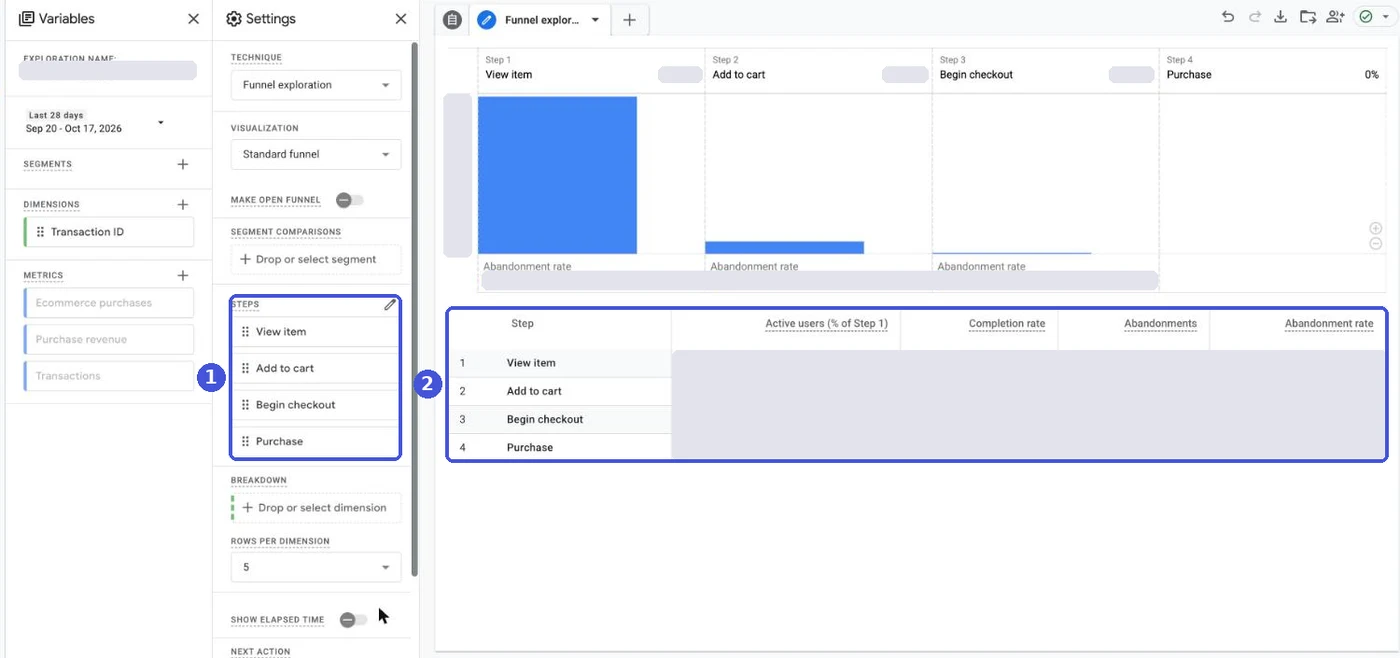
If an event doesn’t appear in the list, ecommerce tracking isn’t set up. On Shopify, you need a custom pixel or app that sends these events; see Shopify custom pixels. If add_to_cart or begin_checkout stays at zero, fix that first. For more on building explorations, see GA4 explorations.
Use Clarity to see why people drop off
GA4 tells you where. Microsoft Clarity (https://clarity.microsoft.com/) is faster for why, and it’s free.
Focus on three things:
- Dashboard insights: Rage clicks, Dead clicks, Excessive scrolling and Quick backs, each as a percentage of sessions. They show where people tapped expecting something to happen, and which pages they bounced back from
- Recordings: filter to pages at your weak stage and watch a handful of sessions that left
- Heatmaps: check scroll depth to see whether key information sits where nobody scrolls
Form a hypothesis from GA4 numbers, then confirm it in Clarity recordings. That’s the fastest way to work.
Fixes by stage, and where to start
Each stage has its own set of fixes, and checkout, then product pages, then traffic is usually the best return for the effort. Once you’ve found the weak stage, pick from the fixes for it.
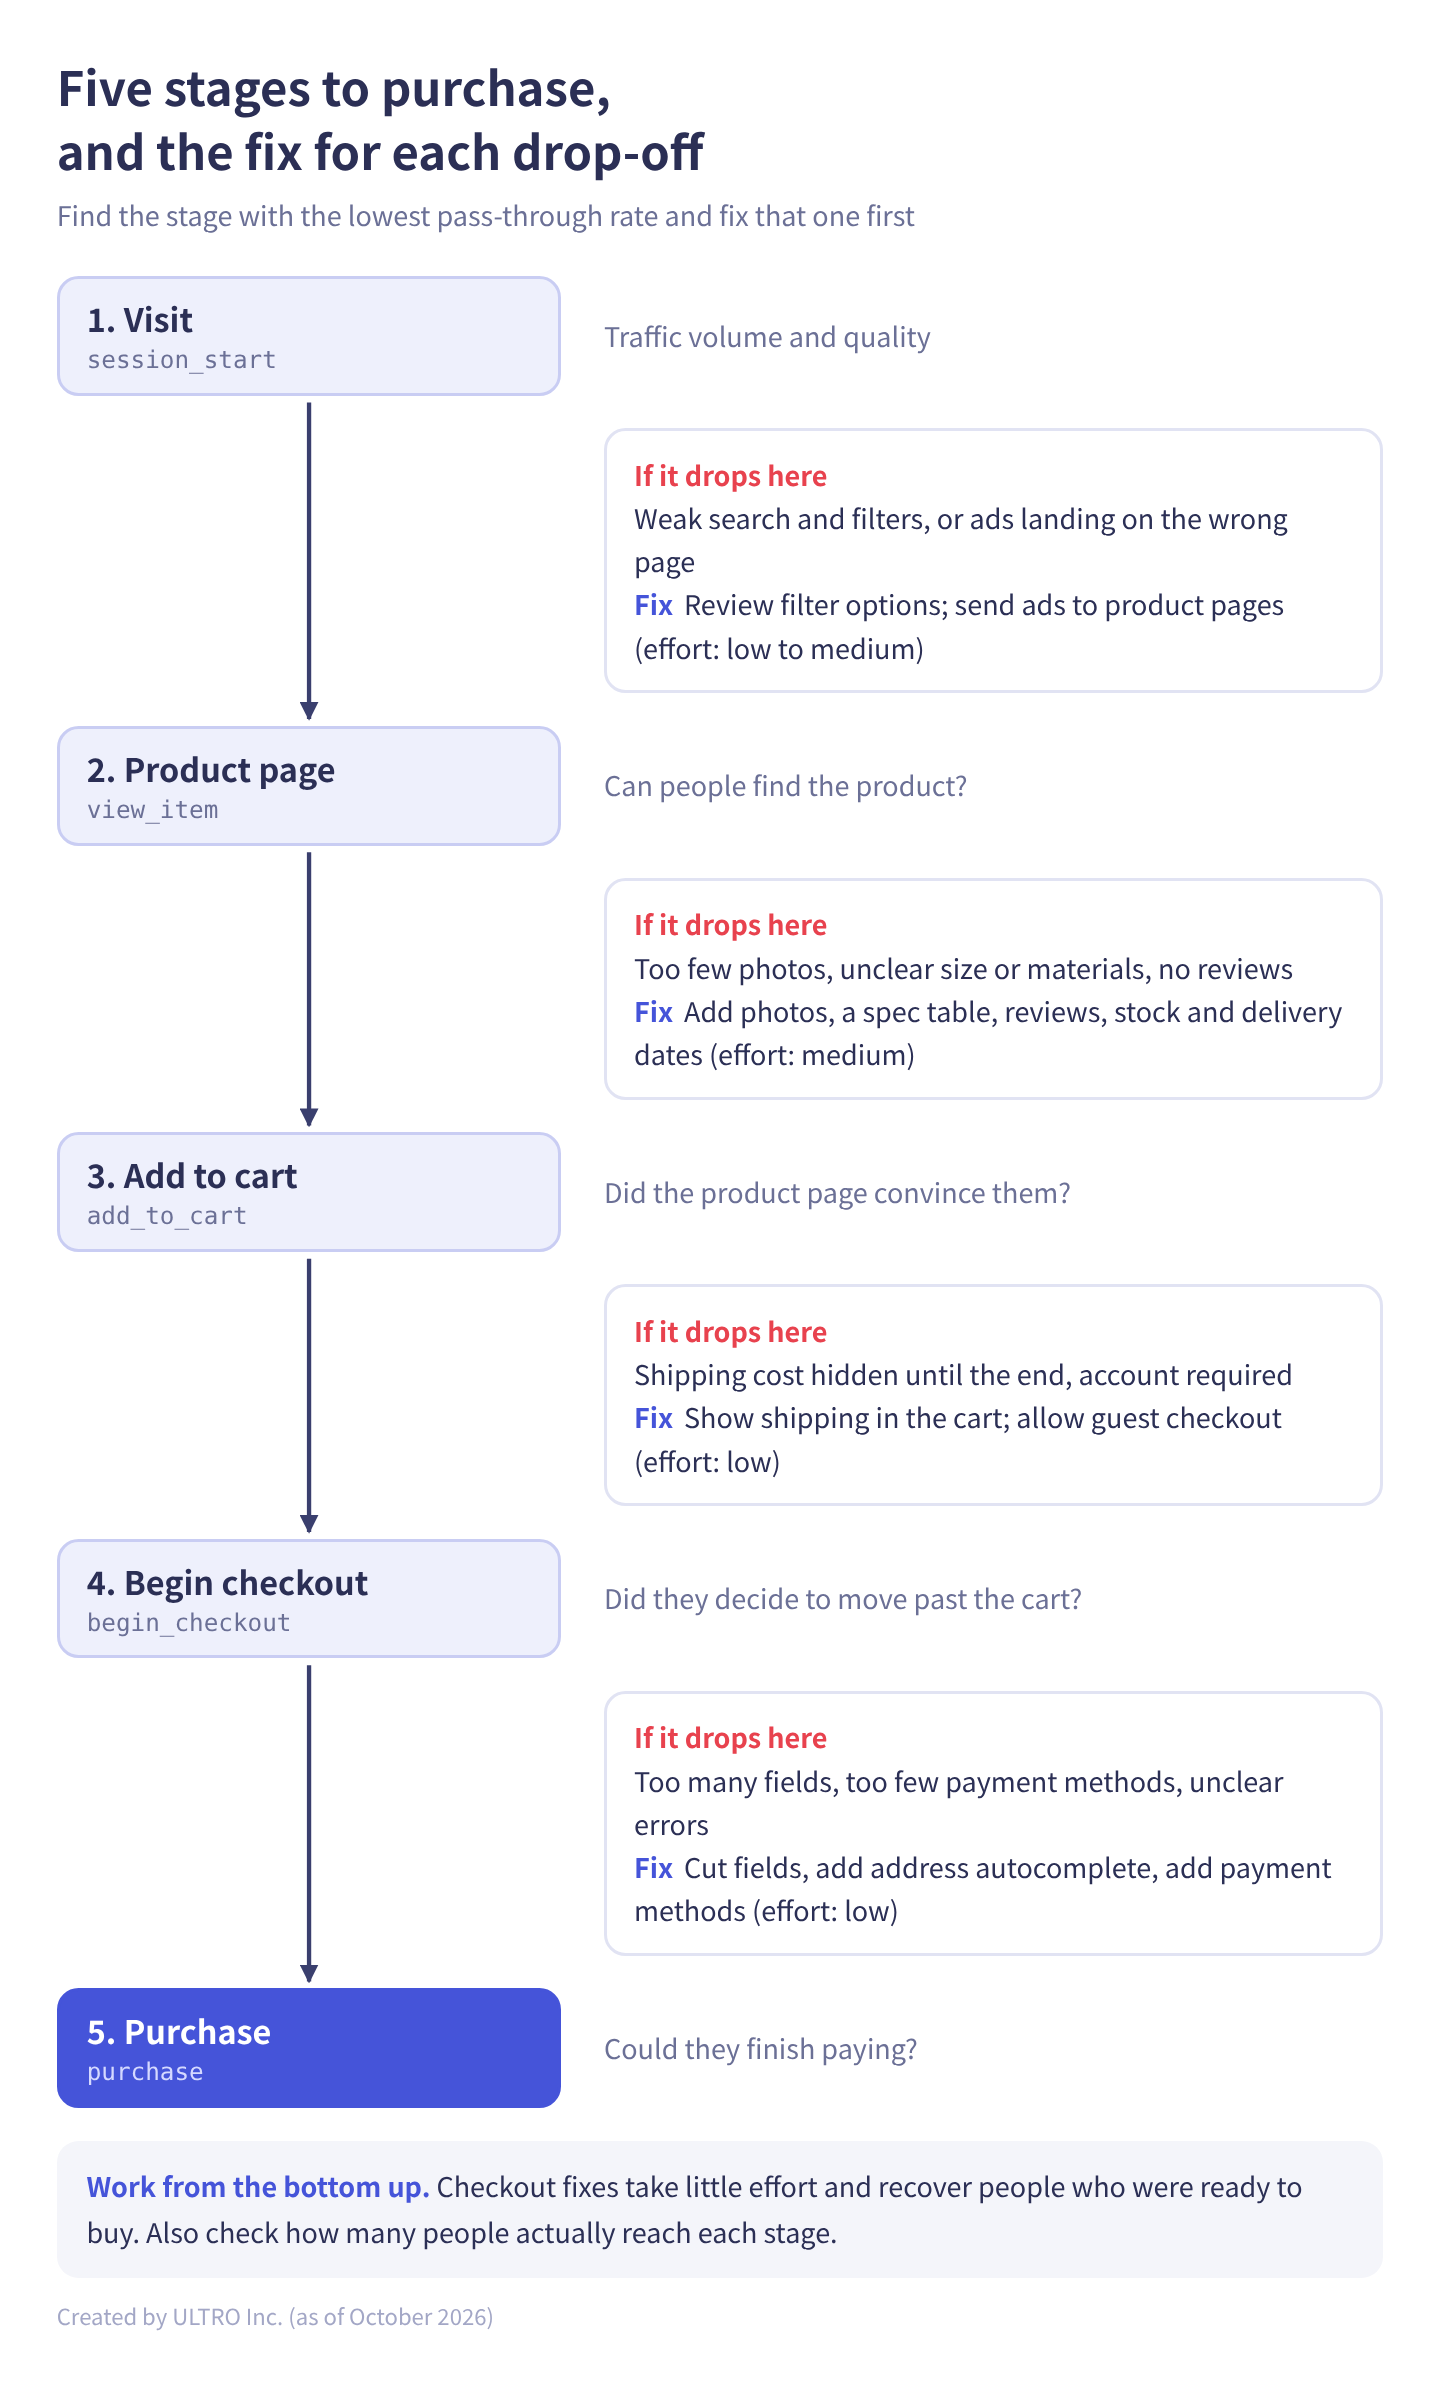
As a table:
| Where it drops | Common causes | Fixes | Effort |
|---|---|---|---|
| Visit → product page | Weak search and filters, ads landing on the wrong page | Review filter options, send ads to product pages | Low to medium |
| Product page → add to cart | Too few photos, unclear size or materials, no reviews | Add photos, a spec table, reviews, stock and delivery dates | Medium |
| Add to cart → begin checkout | Shipping cost hidden until the end, account required | Show shipping in the cart, allow guest checkout | Low |
| Begin checkout → purchase | Too many fields, too few payment methods, unclear errors | Cut fields, add address autocomplete, add payment methods | Low |
We recommend working from the bottom up. Checkout fixes take little effort, and they recover people who were already ready to buy. Product page work has a bigger payoff but takes longer, since it means new photos and copy. Fixing traffic takes longer still.
Also check how many people actually reach each stage. If only 20 people a month begin checkout, fixing the checkout form adds a few orders at most. In that case, fixing the stages above it, product pages and add to cart, grows the total more. Decide on both effort and volume.
A full site redesign is the last resort, for when none of these rows fits. Fixing the stage that’s leaking is cheaper when you guess wrong.
What to change first on Shopify
On Shopify, start with checkout, shipping and account settings, not the theme. You can’t customize checkout freely, but a lot can be fixed with settings alone:
- Shipping cost: show it on the cart page. Hiding it until checkout increases drop-off
- Guest checkout: make sure customers aren’t required to sign in before checkout. Check the sign-in settings under Settings > Checkout and Settings > Customer accounts
- Payment methods: offer Shop Pay, Apple Pay, Google Pay and PayPal, and consider a buy now, pay later option such as Shop Pay Installments, Klarna or Afterpay. Accelerated checkout buttons on the cart help too
- Checkout fields: make unnecessary fields (company name, address line 2) optional or hide them
- Mobile page speed: product image sizes and the number of apps. Uninstalled apps can leave tags behind
Theme work can wait until you’ve been through this list.
A higher conversion rate can lower revenue
Conversion rate is only one of three numbers that make up revenue, and pushing it alone can lower revenue or margin. Targeting conversion rate alone pulls you toward discounts and coupons. Conversion rate goes up, average order value goes down, revenue stays flat, and margin shrinks.
Look at all three together:
Revenue = sessions × conversion rate × average order value
When you ship a conversion rate fix, check average order value and sessions alongside it. Watching only one, you can think you’ve improved while cutting into profit. For judging ad efficiency in the same terms, see ROAS.
Compare revenue before and after a change
Enter sessions and the conversion rate and average order value before and after a change to see what happens to revenue. The defaults are an example: conversion rate rises from 1.5% to 1.8% while average order value falls from $80 to $65.
Everything is calculated in your browser, and nothing you enter is sent anywhere. Sessions are assumed to be the same before and after.
The formula is revenue = sessions × conversion rate × average order value. Break-even order value is the average order value that, at the new conversion rate, gives the same revenue as before. Below it, revenue has fallen even though conversion rate went up.
Common misconceptions about conversion rate
The two most common mistakes are judging your rate against an average, and judging a change by overall conversion rate alone. Five we hear often:
“We’re within the 1–3% average, so we’re fine.” Industry medians differ by 3x, so a cross-industry average can’t tell you. A beauty store at 1.5% is well below its industry median of 2.8%.
“Mobile always converts worse.” In Littledata’s benchmark, median conversion rate was 1.5% on both mobile and desktop. If your mobile rate is low, the cause is probably at the product page or add-to-cart stage.
“Conversion rate changed suddenly, so it must be the thing we just shipped.” Shopify changed how it counts sessions on September 21, 2026. Check for tracking changes, sales and shifts in ad spend first.
“Overall conversion rate went up, so the change worked.” More traffic from high-converting sources like branded search or email lifts overall conversion rate with no site change at all. Compare by traffic source.
“Higher is always better.” Conversion rate bought with discounts lowers average order value. Use the calculator above to find your break-even order value.
Troubleshooting
When the numbers look wrong, suspect your tracking and how you’re comparing before you blame your changes. Five common situations:
GA4 and Shopify conversion rates don’t match They’re based on different sessions: Shopify’s own count versus sessions where the GA4 tag ran. Cookie refusals, ad blockers and disabled JavaScript make GA4 undercount. Pick one as the source of truth and track trends on it (see “Why Shopify, GA4 and ad platforms report different conversion rates” above).
add_to_cart and begin_checkout aren’t tracked Your custom pixel may not be sending them. Having purchases but nothing in between is a common state.
Every stage converts poorly Suspect traffic quality. Lots of display or social traffic lowers every stage. Splitting by traffic source tells you whether it’s a traffic problem or a site problem.
Conversion rate suddenly dropped Before suspecting a change, place a test order yourself, and look at orders by hour. If orders are zero during certain hours, suspect a payment or app problem.
The numbers moved, but you can’t tell whether your change caused it Check whether the change overlapped with a sale, an ad push or seasonality. Compare with the same month last year, or against a traffic source the change didn’t touch. To isolate the effect properly, run an A/B test.
If your tracking isn’t ready yet
The five-stage method assumes GA4 ecommerce tracking is in place. If it isn’t, or the numbers look off, sort that out first. For Shopify, start with setting up GA4 on Shopify and the missing purchases article linked in the section on why the numbers differ. To track purchase as a key event, see GA4 key events.
Sources
- Ecommerce conversion rate benchmark (Littledata) (calculated October 14, 2026; 427 stores)
- Add to cart rate benchmark (Littledata)
- Checkout completion rate benchmark (Littledata)
- Behavior reports (Shopify Help Center)
- Changes to sessions and conversion rate in Shopify Analytics (Shopify Help Center)
- Analytics discrepancies (Shopify Help Center)
- Conversion rate: Definition (Google Ads Help)
- [GA4] Funnel exploration (Google Analytics Help)
- Cart Abandonment Rate Statistics (Baymard Institute)
- Microsoft Clarity documentation (Microsoft Learn)
FAQ
How do you calculate ecommerce conversion rate?
Purchases ÷ sessions × 100. Shopify's Conversion rate is the percentage of sessions that resulted in a purchase. In GA4, mark purchase as a key event and look at Session key event rate in the Traffic acquisition report, filtered to purchase. Dividing by users instead gives a bigger number, so agree internally on which denominator you use.
What is the average Shopify conversion rate?
Littledata's benchmark of 427 Shopify stores' GA4 data shows a median of 1.4%, a mean of 1.9%, a top-20% threshold of 2.6% and a top-10% threshold of 3.6% (90 days from July 13 to October 10, 2026). The mean is higher than the median because a few stores pull it up, so compare yourself against the median.
What is a good conversion rate for ecommerce?
Above 2.6% puts a Shopify store in the top 20% of Littledata's benchmark, and above 3.6% in the top 10%. But it depends heavily on industry: 1.5% is above the median for furniture and well below it for beauty. Your own trailing 12 months is a better target than any cross-industry average.
Does conversion rate vary by industry?
A lot. In the same Littledata benchmark, the medians were 2.8% for beauty and skincare, 2.4% for health and supplements, 2.3% for food and beverage, 1.2% for fashion and apparel, and 0.9% for home and furniture. Higher-priced categories like furniture convert lower.
Where do I find conversion rate in Shopify?
In the Shopify admin, go to Analytics > Reports, click the Category filter, and select Behavior. Conversion rate breakdown shows four steps: all sessions, sessions with cart additions, sessions that reached checkout, and sessions that completed checkout. Conversion rate over time shows the trend.
Why don't Shopify and GA4 conversion rates match?
They count sessions differently. Shopify counts with its own tracking and filters out bots; GA4 counts sessions where its tag ran. Cookie refusals, ad blockers and disabled JavaScript make GA4 undercount. Pick one as your source of truth and track trends on that one.
Why did my Shopify conversion rate change in late September 2026?
Shopify updated how it counts sessions between September 21 and 23, 2026. Bot filtering and sessions that cross midnight UTC are handled differently, so sessions and conversion rate can shift while orders and sales don't. Treat before and after as different baselines.
Does a higher conversion rate always mean more revenue?
No. Raising conversion rate with discounts and coupons can lower average order value enough that revenue stays flat or drops. Look at conversion rate, average order value and sessions together.
- Conversion rate is purchases ÷ sessions. Dividing by users changes the number, so pick one denominator.
- Across 427 Shopify stores, the median is 1.4% and the top 20% start at 2.6% (Littledata, July to October 2026). Industry medians range from 0.9% to 2.8%.
- In Shopify, find it under Analytics > Reports > Behavior. Shopify changed how it counts sessions on September 21, 2026.
- Shopify, GA4 and ad platforms use different denominators, so they won't match. Choose one yardstick.
- Split the path to purchase into five stages and fix the one with the lowest pass-through rate. Checkout, then product pages, then traffic is usually the best return for the effort.
Written byRyushi Nagata
CEO, ULTRO Inc. (Tokyo)Shopify Partner. Ryushi handles Shopify store builds, maintenance, advertising and CRM end to end, and has managed more than ¥4 billion in ad spend over his career. He holds Google Ads certifications (Search, Display, Video, Shopping, Apps, Performance Max, Measurement) and the Google Analytics certification.
How many purchases is GA4 missing in your store?
GapFill matches your Shopify orders against GA4 purchases, shows what GA4 missed, and recovers those purchase events server-side. It works alongside your existing tags, and the missing purchases report is free.