GA4 Sessions and Users: Definition, Timeout, Why Totals Differ

What a GA4 session is and when it ends, why daily numbers and table rows don't add up to the totals, how the four user metrics differ, how to view Monday-to-Sunday weeks, and how event counts differ from users.
A GA4 session is one period of someone using your site or app, and it ends after more than 30 minutes of inactivity. Users and sessions are estimates of deduplicated counts, so daily numbers don’t add up to the number for the whole date range, and table rows don’t add up to the total row. When the numbers don’t match, it’s usually this counting method, not a tracking bug.
This article covers what a session is and when it ends, every reason the totals don’t match, how the four user metrics differ, how to view weeks that start on Monday, and how event counts differ from users. The interface and specs are as of October 2026. Other metrics are covered in our guide to GA4 metrics.
What is a session in GA4?
A GA4 session is a period of time a user spends on your site or app. It starts when a page opens and ends after more than 30 minutes of inactivity.
Google’s help center says a session starts when a user opens your app in the foreground, or views a page or screen when no session is currently active. When it starts, GA4 automatically collects a session_start event, and the session count is based on it. There’s no limit to how long a session can last.
A GA4 session ends after 30 minutes of inactivity
By default, a GA4 session ends after more than 30 minutes of inactivity. If the person does something after that, GA4 counts it as a new session.
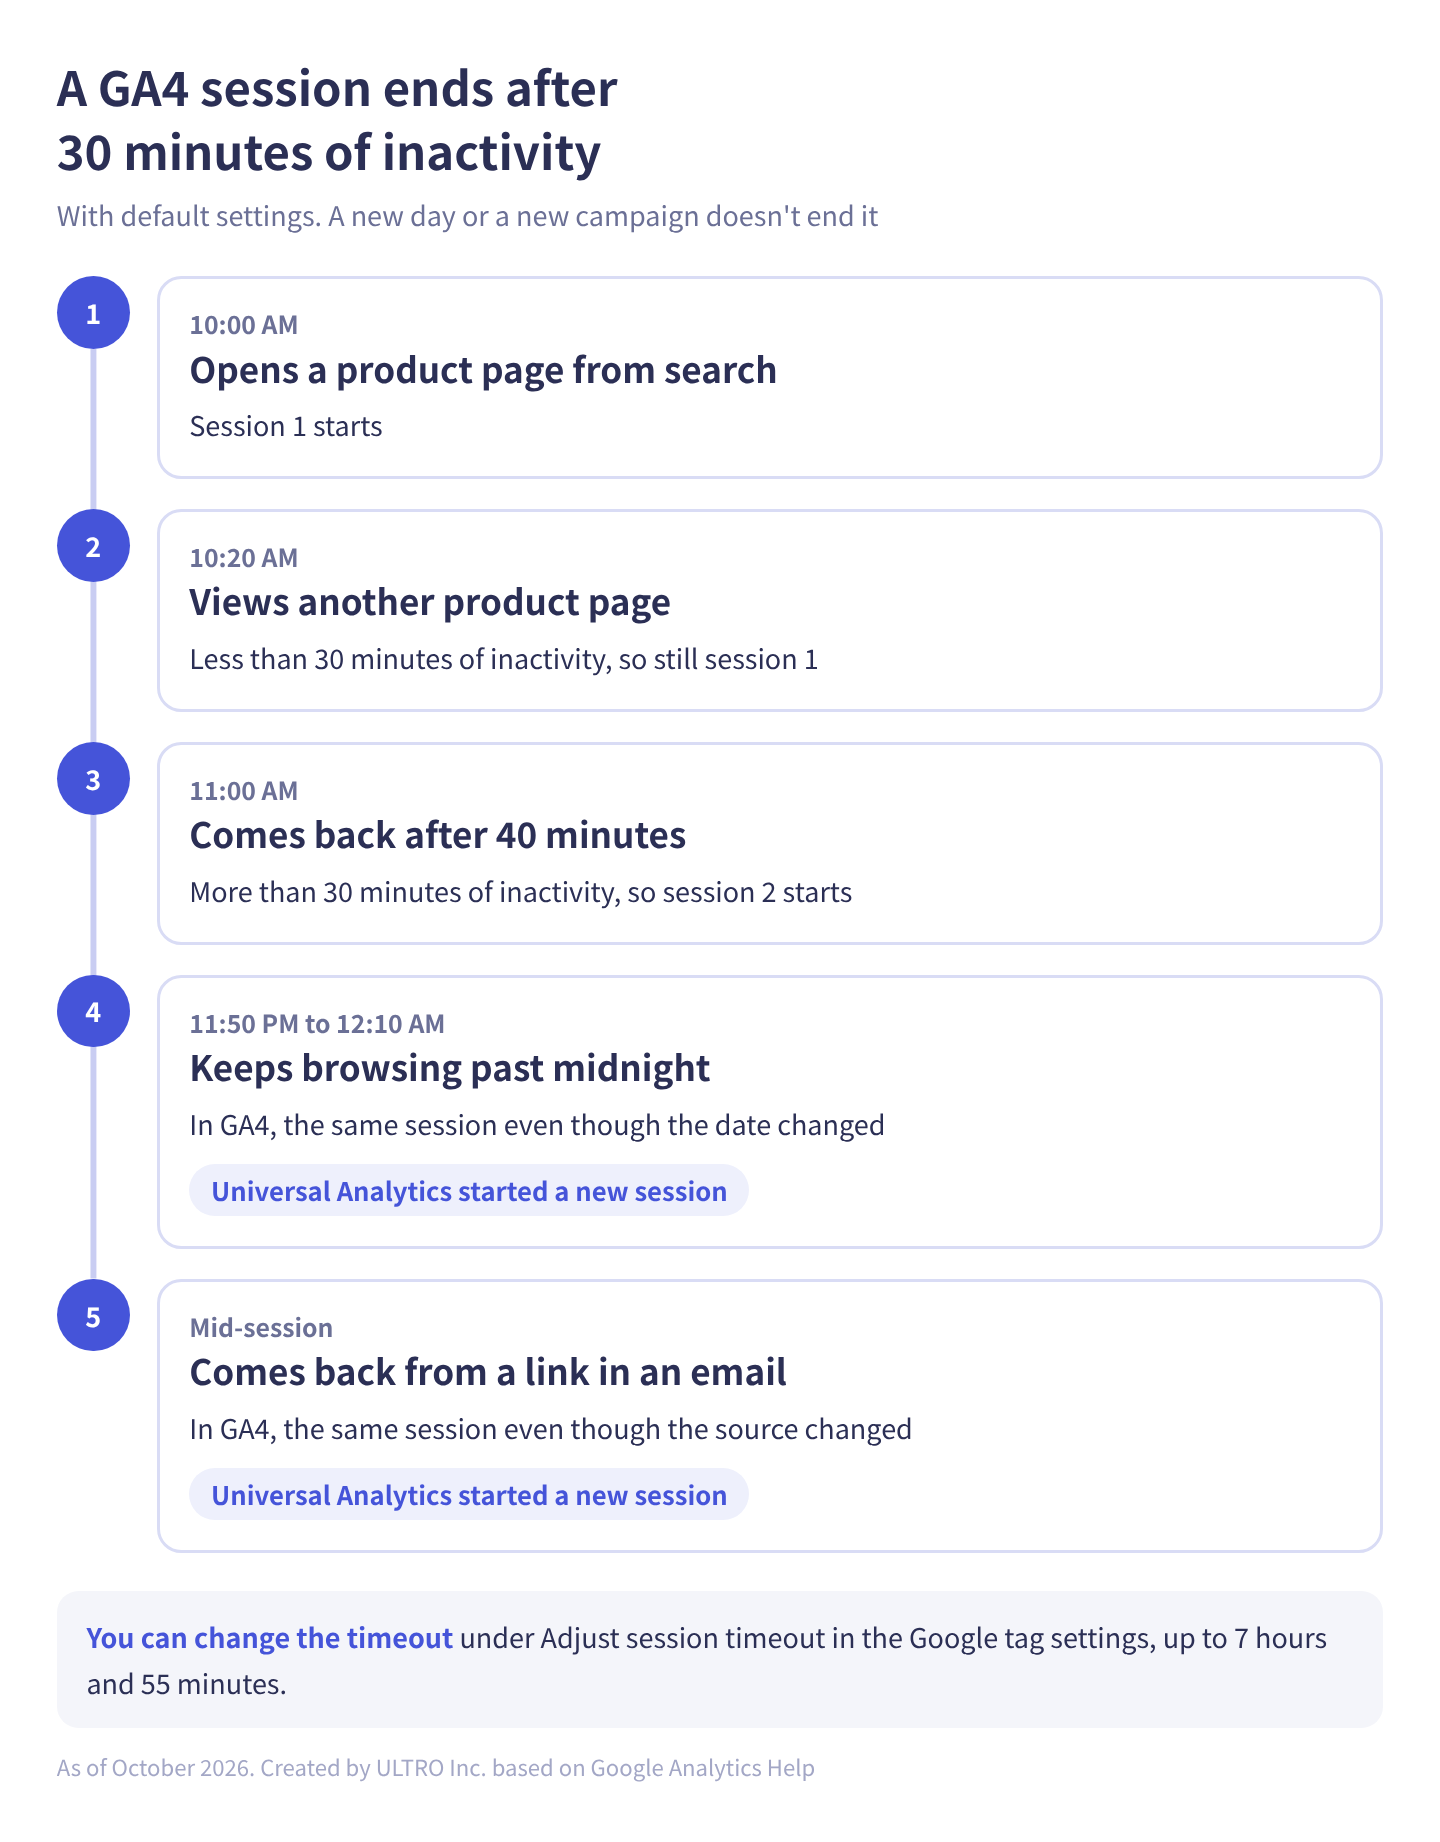
Case by case:
| What happens | GA4 | Universal Analytics |
|---|---|---|
| More than 30 minutes of inactivity | New session | New session |
| The date changes (past midnight) | Same session | New session |
| The visitor comes back from a different ad or campaign mid-session | Same session | New session |
If you moved over from Universal Analytics, GA4 session counts look lower. Sessions don’t break at midnight or on a new campaign, so each one runs longer. Google’s help center also notes that UTM tags on internal links reset the session in Universal Analytics, so in our view sites that used them will see a bigger drop in GA4.
Because a change of source mid-session doesn’t start a new session, a session’s traffic source comes from what was attached when it started. In Google’s dimensions reference, Session default channel group is the channel associated with the start of the session. Sources are assigned with a last non-direct click approach: a session that starts direct (from a bookmark or a typed URL) is attributed to that user’s previous non-direct source within the lookback window. If you see (not set) in session dimensions, our article on GA4 (not set) covers the causes.
How to change the session timeout
You can change the timeout here:
- In Admin, under Data collection and modification, click Data streams and open your web stream.
- Under Google tag, click Configure tag settings.
- Under Settings, click Show more, then open Adjust session timeout.
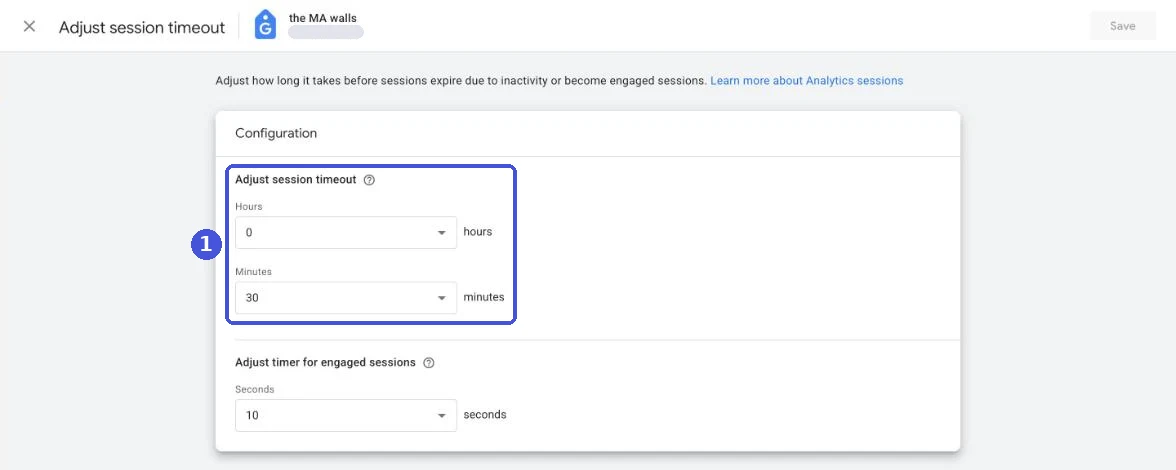
The timeout can go up to 7 hours and 55 minutes. On the same screen, you can change how many seconds a session needs to count as engaged (10 seconds by default).
Our take: for an online store, leave it at 30 minutes. Someone who compares products and leaves for more than 30 minutes is usually rethinking the purchase when they come back, so counting it as a separate visit is closer to what actually happened. If your site is built around long videos or long reads, and many people keep watching for more than 30 minutes without interacting, consider raising it. Either way, the numbers change from the day you change the setting, so write the date down.
Engaged sessions
A session counts as an engaged session if it lasts longer than 10 seconds, has a key event, or has two or more page or screen views. The share of engaged sessions is the engagement rate, and the rest is the bounce rate.
Why GA4 session and user totals don’t add up
Users and sessions in GA4 aren’t additive, so daily numbers don’t add up to the number for the date range, and table rows don’t add up to the total. Here’s which numbers drift and why.
| Numbers that don’t match | Main reason | Basis |
|---|---|---|
| Sum of daily users vs users for the date range | Someone who visits on different days counts once per day in the daily numbers but once for the range, so the daily sum is higher | Google’s definition (unique users) |
| Sum of users across rows (by source, say) vs the table total | Someone who came from two sources appears in both rows, but once in the total | Our reading of Google’s definition |
| Sum of sessions across rows vs the table total | The total and each row are estimated separately with HyperLogLog++, so they drift slightly | Our reading of Google’s estimation method |
| New users plus returning users vs total users | Someone who visits for the first time and comes back in the same range can count in both | Our reading of Google’s definition |
| Active users vs total users | On the web, a user is active when GA4 collects first_visit or engagement_time_msec. Someone with only events lacking engagement_time_msec (such as server-only Measurement Protocol events) counts only in total users | Google Analytics Help |
| Rows add up to less than the total | Thresholds withhold some rows; with many rows, the extras are grouped into (other) | Google Analytics Help |
| Exploration numbers vs report numbers | When an exploration exceeds the event limit, GA4 estimates from a subset of the data (sampling) | Google Analytics Help |
| Report numbers vs numbers counted in BigQuery | Reports use estimates and are affected by behavioral modeling and reporting identity | Google Analytics Help |
Users are deduplicated people
Users are deduplicated, so if you split the date range and add up the pieces, you count the same people again. Google’s help center defines active users as the number of unique users who engaged with your site or app in the date range, and total users as the number of unique users who triggered any event.
For example, if the same person visits on Monday and Tuesday, they count once on each day but once for the two days combined. When you need a monthly number, don’t add up daily numbers. Set the date range to the month. The same goes for weeks.
Table rows work the same way. Someone who first comes from organic search and comes back another day from an ad appears in both rows of the Traffic acquisition report, but only once in the total row. That overlap is why the rows can add up to more than the total.
Users and sessions are estimates
Active users, total users and sessions in GA4 reports aren’t counted one by one. They’re estimates calculated with a method called HyperLogLog++ (HLL++). For sessions, Google’s help center says GA4 began switching to this method in October 2021.
Because they’re estimates, they differ slightly from the actual counts. Google describes the estimates as highly accurate but doesn’t publish an error rate. The session count is an estimate of the number of unique session IDs.
The estimate applies to the total row and to every other row. So even when each session belongs to exactly one row’s source, the rows still add up to a slightly different number than the total. That’s our reading of Google’s explanation, and how far it drifts depends on your data.
If you need exact counts, count them in data exported to BigQuery. BigQuery data has no estimation or modeling applied, so treat it as a different number from the reports.
Thresholds can withhold rows
When thresholds apply, some rows aren’t shown, so the remaining rows add up to less than the total. Google’s help center says data may be withheld when a report or exploration includes demographic data, when a row includes search query data and there aren’t enough total users, and when a date range has low user or event counts.
To check whether thresholds apply, look at the data quality indicator at the top of the report. You can’t turn thresholds off yourself. A longer date range sometimes brings more rows back.
For dimensions with many distinct values, the rows beyond the limit are grouped into a single row called (other). That also keeps the rows from matching the total.
Explorations can be sampled
When an exploration covers more events than the limit, GA4 estimates the whole from a subset of the data (sampling), and the numbers no longer match the reports. The limit for standard properties is 10 million events.
When sampling applies, the data quality indicator at the top right of the exploration shows what share of the data was used. A shorter date range makes sampling less likely. How to use explorations is covered in our guide to GA4 explorations.
Rules for reporting the numbers
This is our take. Even when you know why the numbers don’t match, explaining it in every report takes time. Agree on three rules and mismatched numbers stop being a fire drill:
- Pull weekly and monthly numbers with that period as the date range. Don’t build them by adding up daily numbers.
- When comparing with an earlier period, use the same weekday boundaries and the same reporting identity.
- Don’t build a total by adding up rows. Use the value in the total row.
GA4 has four user metrics
GA4 has four user metrics: active users, total users, new users and returning users. When a report just says Users, it means active users.
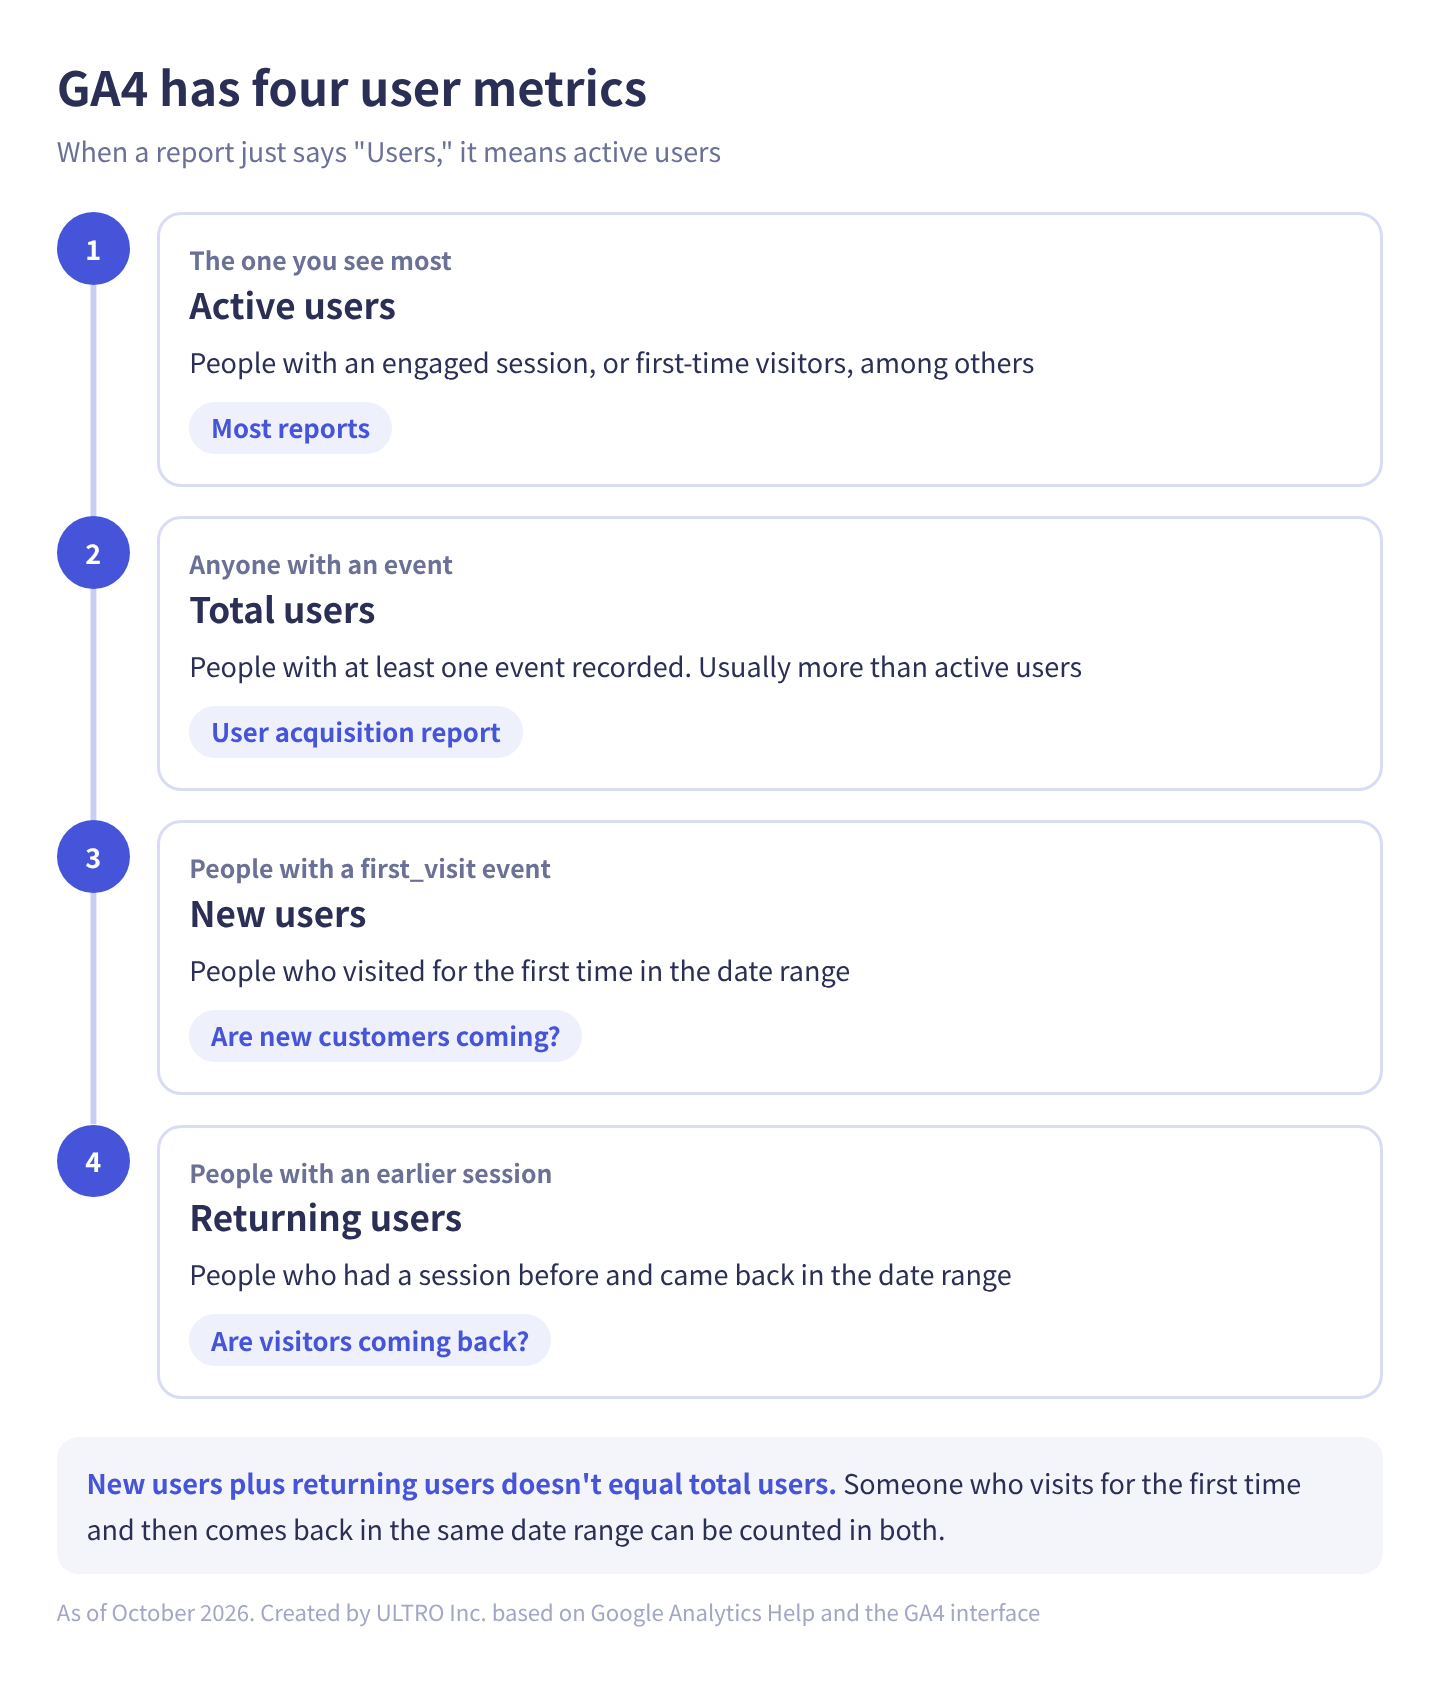
In table form:
| Metric | Who it counts | Where you mostly see it |
|---|---|---|
| Active users | People with an engaged session, or for whom GA4 collected first_visit or engagement_time_msec | Most reports. A column labeled just Users is this metric |
| Total users | People with at least one event recorded | User acquisition report |
| New users | People visiting for the first time (a first_visit event was recorded) | User acquisition, Traffic acquisition |
| Returning users | People who had at least one earlier session and started a session again in the date range | User acquisition |
Google’s help center says an active user is any user who has an engaged session, or, on a website, for whom GA4 collects the first_visit event or the engagement_time_msec parameter. So someone who opened a page and closed it right away still counts as an active user if it was their first visit.
How the four numbers relate
Google’s help center says new users and active users won’t exceed total users. Not every new user is active, though, so new users can exceed active users. Thresholding and similar factors can make these relationships look broken.
Someone who visits for the first time and comes back in the same date range can count as both a new user and a returning user, so the two don’t add up to total users. Use new users to see whether new customers are arriving, and returning users to see whether visitors come back, and read them separately.
User acquisition and Traffic acquisition count sources differently
Dimensions in the User acquisition report start with “First user,” and count the source of the person’s first visit (user scope). Dimensions in the Traffic acquisition report start with “Session,” and count the source of each visit (session scope). That’s why the same Organic Search channel shows different numbers in the two reports.
How GA4 decides who’s the same person depends on a setting
How GA4 decides two visits are the same person is set under Admin > Data display > Reporting identity.
| Setting | How it identifies the same person |
|---|---|
| Blended | Uses the User-ID if there is one, then the device ID, then modeling |
| Observed | Uses the User-ID if there is one, otherwise the device ID |
| Device-based | Uses the device ID only |
If the same person visits on a phone and a laptop, Device-based counts two people. If you send a User-ID, Blended and Observed can merge them into one. Google’s help center says this setting doesn’t affect data collection or processing and can be switched at any time. Switching it changes user counts in reports, so compare periods with the same setting.
How to view weeks starting on Monday in GA4
The Week dimension in GA4 starts on Sunday. If your reporting week runs Monday to Sunday, set the date range on the calendar yourself.
In Google’s Data API schema, Week is a two-digit number from 01 to 53, weeks start on Sunday, and January 1 is always in week 01. So in most years, the first and last weeks of the year are shorter than seven days. That’s why the week around New Year’s looks small.
To see numbers by Monday-to-Sunday week, use one of these:
- In a report or exploration, pick Monday through Sunday on the calendar next to the date range.
- When pulling data through the Data API, use isoWeek (ISO week of the year), where each week starts on Monday.
If you build weekly numbers by adding up daily numbers from Monday to Sunday, users get double counted. Pull one week at a time, or pull data with isoWeek as a dimension.
Views and event count vs users
Views and event count are counts of actions, and users is a count of people. However many times the same person opens a page, only views and event count go up.
| Metric | What it counts |
|---|---|
| Views | Times a web page or app screen was shown (page_view and screen_view events), including reloads of the same page |
| Event count | Every event recorded |
| Users | Deduplicated people (estimated) |
| Sessions | Deduplicated visits (estimated) |
Views is what Universal Analytics called pageviews.
Event count adds up every event: page_view, scroll, view_item, add_to_cart and so on. On its own it’s hard to read, so filter it to the event you care about, for example by Event name in the Events report. Which events GA4 collects and how to add your own is covered in our guide to GA4 events.
This is our take: because event count and views count actions, daily numbers add up to almost exactly the number for the date range. Unlike users, there’s nothing to deduplicate. Putting event count next to total users, as “actions per person,” makes changes in how people use your site easier to spot.
Shopify counts sessions with a different system
Shopify’s sessions and visitors and GA4’s sessions and users are counted by different systems, so they won’t match. Shopify’s changelog says that on September 21, 2026, it updated session measurement to focus the default sessions view on human visitors where the human-or-bot filter is available. Shopify treats reports after that date as a new baseline, so be careful comparing Shopify sessions across it.
Some of this is our inference: when GA4 shows lower numbers, it’s usually a mix of these:
- Some visitors close the page before the GA4 tag loads.
- Ad blockers or browser settings keep the GA4 tag from running for some visitors.
- Visitors who decline in a consent banner aren’t sent to GA4, or are sent differently.
Rather than deciding which one is right, compare GA4 numbers within GA4 and Shopify numbers within Shopify, each against an earlier period. If GA4 purchases come in lower than Shopify orders, matching them order by order shows which payment methods or sales channels are leaking. The steps are in GA4 Not Tracking All Shopify Purchases? Our Shopify app GapFill recovers missing GA4 purchase events server-side and works alongside your existing tags, and the missing purchases report is free. It’s our own product, so read with that in mind.
Our Shopify appGapFill: Recover missing GA4 purchase events server-sideWorks alongside your existing tags. Free missing purchases report.See GapFill →Sources
- [GA4] Understand user metrics (Google Analytics Help)
- [GA4] About Analytics sessions (Google Analytics Help)
- [GA4] Sessions (Google Analytics Help)
- [GA4] Configure your Google tag settings (Google Analytics Help)
- [GA4] Reporting identity (Google Analytics Help)
- [GA4] Data thresholds (Google Analytics Help)
- [GA4] About data sampling (Google Analytics Help)
- [GA4] Comparing metrics: Google Analytics vs. Universal Analytics (Google Analytics Help)
- [GA4] Analytics dimensions and metrics (Google Analytics Help)
- Unique count approximation in Google Analytics (Google for Developers)
- API Dimensions & Metrics (Google for Developers)
- Shopify analytics session measurement improvements (Shopify Changelog)
FAQ
What is a session in GA4?
A session is one period of someone using your site or app. When a page opens, GA4 records a session_start event, and sessions are counted from those. By default, a session ends after more than 30 minutes of inactivity.
How long is a GA4 session timeout?
The default is 30 minutes of inactivity. You can raise it to as much as 7 hours and 55 minutes under Adjust session timeout in the Google tag settings.
Does a GA4 session end at midnight or when a visitor returns from a different campaign?
No. Universal Analytics started a new session at midnight and when new campaign parameters arrived, but GA4 keeps counting the same session in both cases.
Why don't my daily users add up to the monthly number?
Users are deduplicated, so someone who visits on three different days counts once per day in the daily numbers but once in the monthly number. The number is also a HyperLogLog++ estimate, so it won't follow simple addition. Pull the monthly number with a one-month date range.
Why don't the rows in my GA4 table add up to the total row?
Someone who appears in several rows still counts once in the total. Sessions are estimated separately for the total and for each row. Rows withheld by thresholds or grouped into (other) also keep the rows from matching the total.
What's the difference between active users and total users in GA4?
Total users is everyone who triggered at least one event. Active users is people with an engaged session, first-time visitors and a few similar cases. When a report just says Users, it means active users.
Can I view weeks starting on Monday in GA4?
The Week dimension starts on Sunday. To view a Monday-to-Sunday week, set the date range on the calendar. In the Data API, use isoWeek, which starts on Monday.
Why don't Shopify sessions match GA4 sessions?
They're counted by different systems, so they won't match. Compare Shopify numbers within Shopify and GA4 numbers within GA4, each against an earlier period. Shopify also updated its session measurement on September 21, 2026, so be careful comparing across that date.
- A GA4 session ends after more than 30 minutes of inactivity (adjustable up to 7 hours 55 minutes). A new day or a new campaign doesn't end it.
- Users and sessions are deduplicated counts estimated with HyperLogLog++. Daily numbers and table rows don't add up to the totals.
- Thresholds that withhold rows and sampling in explorations also make totals differ.
- Users in reports means active users, which is different from total users, new users and returning users.
- The Week dimension starts on Sunday. For Monday-to-Sunday weeks, set the date range yourself.
- Views and event count are counts of actions, so they go up every time the same person repeats something.
Written byRyushi Nagata
CEO, ULTRO Inc. (Tokyo)Shopify Partner. Ryushi handles Shopify store builds, maintenance, advertising and CRM end to end, and has managed more than ¥4 billion in ad spend over his career. He holds Google Ads certifications (Search, Display, Video, Shopping, Apps, Performance Max, Measurement) and the Google Analytics certification.
How many purchases is GA4 missing in your store?
GapFill matches your Shopify orders against GA4 purchases, shows what GA4 missed, and recovers those purchase events server-side. It works alongside your existing tags, and the missing purchases report is free.