GA4 Metrics List: What Each Metric Means, in 8 Groups

GA4's metrics in 8 groups: what each one means and how it's calculated, which metric to use for which question, and how to break ecommerce revenue down into metrics.
Open a GA4 report and you’ll see several metrics with similar names: Active users, Total users, New users. We counted the metrics in Google’s dimensions and metrics reference and got about 140 (as of October 2026).
This article groups them into 8 sets and lists what each one means and how it’s calculated, focusing on the metrics an online store (especially on Shopify) uses most. If you want to start with how to read GA4’s reports, read How to Use Google Analytics 4 for Ecommerce first.
Metrics vs dimensions
A GA4 report table has a column on the left and columns of numbers on the right.
| Dimensions | Metrics | |
|---|---|---|
| What they are | How you split the data | What you count |
| Examples | Channel, page, item name, device | Sessions, users, revenue |
| Where they are in a table | The left column | The number columns to the right |
This article is about metrics.
Metrics and dimensions have scopes
Each dimension and metric has a scope: whether it’s counted per user, per session, per event or per item. Purchases are a good example: Ecommerce purchases (event scope) counts orders, while Items purchased (item scope) counts product units.
Combining fields with different scopes can change what a number means, and some combinations aren’t allowed in Explorations. For example, with Item name in the rows of an exploration, you can’t use Purchase revenue or Ecommerce purchases. For how scopes work, see our GA4 custom dimensions guide.
Read GA4 metrics in 8 groups
Google’s help center sorts metrics into categories such as User, Session, Event, Ecommerce and Advertising. We’ve regrouped them into 8 sets based on how an online store uses them. Here’s the overview.
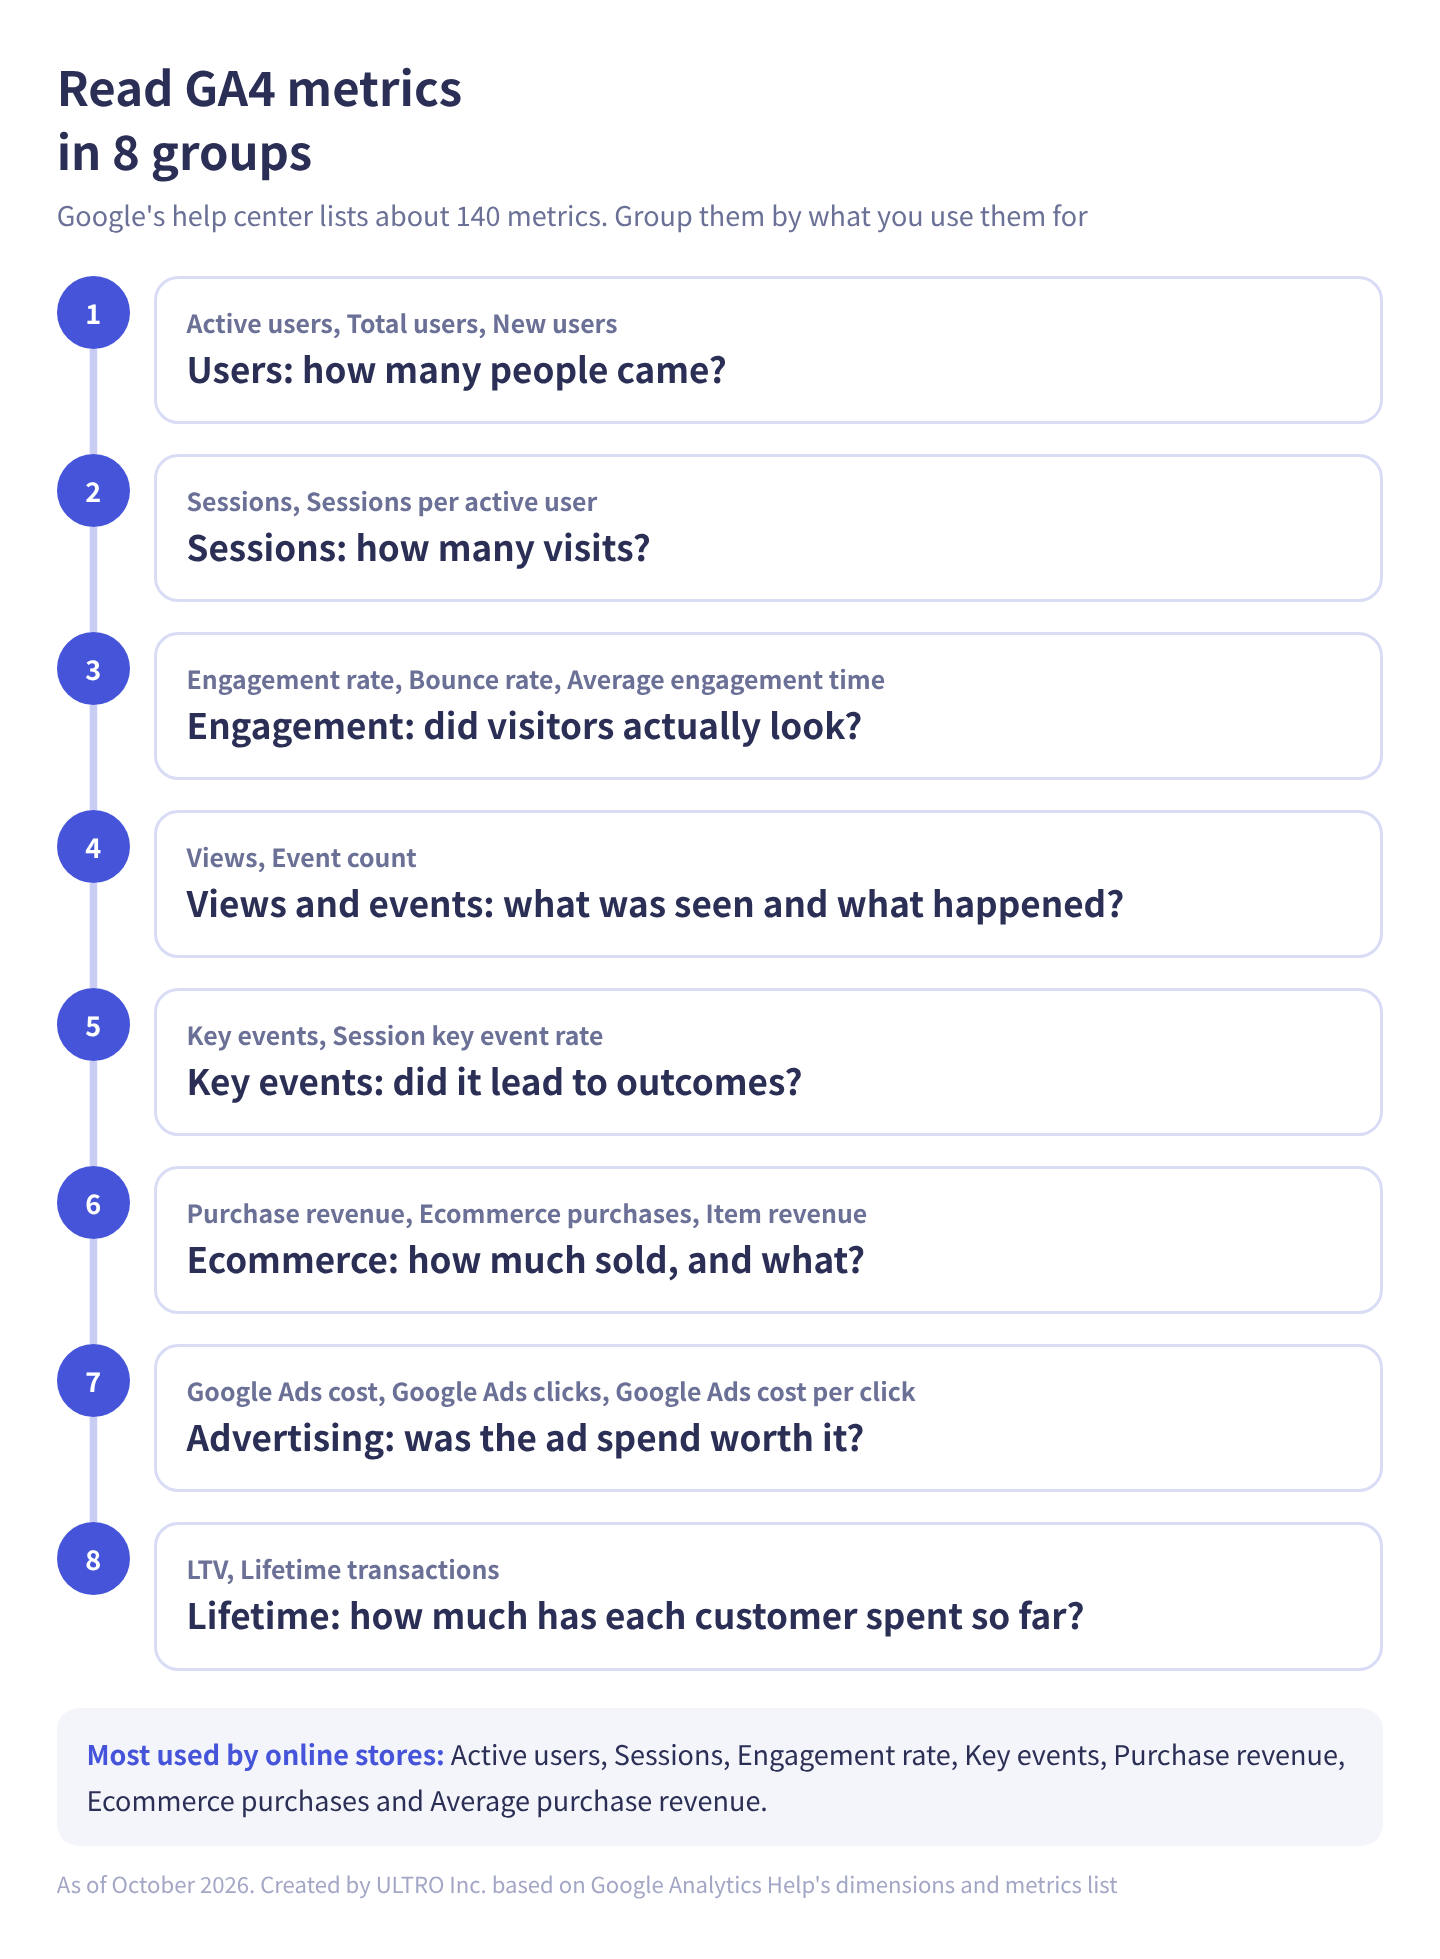
In table form, with links to more detail where we have it:
| Group | Question it answers | Main metrics | More detail |
|---|---|---|---|
| Users | How many people came? | Active users, Total users, New users, Returning users | Users vs sessions |
| Sessions | How many visits? | Sessions, Sessions per active user | Users vs sessions |
| Engagement | Did visitors actually look? | Engagement rate, Bounce rate, Average engagement time | |
| Views and events | What was seen and what happened? | Views, Event count | Users vs sessions |
| Key events | Did it lead to outcomes? | Key events, Session key event rate | Key events |
| Ecommerce | How much sold, and what? | Purchase revenue, Ecommerce purchases, Item revenue | This article |
| Advertising | Was the ad spend worth it? | Google Ads cost, Google Ads clicks, Google Ads cost per click | This article |
| Lifetime | How much has each customer spent so far? | LTV, Lifetime transactions | This article |
The sections below go group by group, with what each metric means and how it’s calculated. Metric names follow the help center’s list; where reports use a different label, it’s noted.
User metrics
| Metric | What it means | Watch out for |
|---|---|---|
| Active users | Distinct users who had an engaged session, or for whom GA4 collected first_visit or engagement time | “Users” in reports means this number |
| Total users | Unique users who logged any event | Higher than Active users |
| New users | Users who interacted with your site for the first time (logged first_visit) | Can be higher than Active users |
| Returning users | Users who had at least one previous session, engaged or not | New users plus returning users doesn’t equal Total users |
| DAU / MAU, DAU / WAU, WAU / MAU | Ratios of daily, 7-day and 30-day active users | A rough measure of how many people keep coming back |
For how Active users differs from Total users, and why New users can exceed Active users, see our guide to GA4 users and sessions.
Session metrics
| Metric | What it means | Watch out for |
|---|---|---|
| Sessions | Sessions that began on your site (session_start events) | By default, a new session starts after 30 minutes of inactivity |
| Sessions per active user | Sessions ÷ Active users | How many times each person visited during the period |
| Average session duration | Average length of sessions, in seconds | Google defines it only as the average session length in seconds; it isn’t based on in-focus time. To see whether people actually looked, use Average engagement time |
| Views per session | Average pages viewed per session | Repeated views of the same page count |
For where sessions end and how to change the timeout, see our guide to GA4 users and sessions.
Engagement metrics
| Metric | What it means | Watch out for |
|---|---|---|
| Engaged sessions | Sessions that lasted longer than 10 seconds, had a key event, or had 2 or more page views | 10 seconds is the default; you can change it in Admin |
| Engagement rate | Engaged sessions ÷ Sessions | Break it down by source and by page |
| Bounce rate | Sessions that weren’t engaged ÷ Sessions (100% − engagement rate) | Defined differently from bounce rate in Universal Analytics |
| Average engagement time | Total time your site was in focus in the browser ÷ Active users | Shown in reports as “Average engagement time per active user” |
| Average engagement time per session | Total time in focus ÷ Sessions | |
| Engaged sessions per active user | Engaged sessions ÷ Active users |
View and event metrics
| Metric | What it means | Watch out for |
|---|---|---|
| Views | Web pages or app screens viewed (page_view and screen_view events) | Repeated views of the same page count. The equivalent of pageviews in Universal Analytics |
| Views per active user | Views ÷ Active users | |
| Event count | Times users triggered events | Use the “All events” dropdown above the table to narrow to one event |
| Events per session | Event count ÷ Sessions | |
| Entrances | Times the first event of a session happened on a page | Which pages people arrived on |
| Exits | Times the last event of a session happened on a page | Which pages people left from |
For how views and events are counted, see our guide to GA4 users and sessions.
Key event metrics
| Metric | What it means | Watch out for |
|---|---|---|
| Key events | Times users triggered an event marked as a key event | Formerly “Conversions.” Narrow to purchase or another event above the table |
| Session key event rate | Share of sessions in which a key event happened | Narrowed to purchase, it’s the share of sessions with a purchase |
| User key event rate | Share of users who triggered a key event |
For choosing key events, counting method settings and why GA4 doesn’t match Google Ads, see our guide to GA4 key events.
Ecommerce metrics
This is the group an online store uses most. For these to show data, events such as view_item, add_to_cart and purchase have to be sent with item information. On Shopify, they are if you’ve connected through the Google & YouTube app.
Revenue and orders: what is Total revenue? (event scope)
Total revenue is purchases plus in-app purchases, subscriptions and ad revenue, minus refunds. For sales on a web store, use Purchase revenue, right below it.
| Metric | What it means | Watch out for |
|---|---|---|
| Total revenue | Purchases + in-app purchases + subscriptions + ad revenue − refunds | For a web store with no ad revenue, nearly the same as Purchase revenue |
| Purchase revenue | Purchases + in-app purchases + subscriptions − refunds | The one to use as ecommerce sales |
| Ecommerce purchases | Times users completed a purchase (purchase events) | |
| Transactions | Completed purchases on your site | For a web store, nearly the same as Ecommerce purchases |
| Average purchase revenue | Average purchase revenue per purchase | Average order value, in effect |
| Refund amount | Total refunded | How much is coming back through returns and cancellations |
| Shipping amount, Tax amount | Shipping and tax sent with purchase events |
Purchasers
| Metric | What it means | Watch out for |
|---|---|---|
| Total purchasers | Users who made at least one purchase during the period | Listed under the User category in the help center |
| First time purchasers | Users who made their first purchase during the period | Whether new customers are growing |
| ARPU | Total revenue ÷ Active users | Revenue per user, including people who didn’t buy |
| ARPPU | Purchase revenue ÷ Active users who made a purchase | Revenue per paying user |
| Transactions per purchaser | Average purchases per buyer during the period | How many times each buyer bought |
Products (item scope)
Product-level numbers go with item-scoped dimensions such as Item name. In Explorations, they can’t be combined with event-scoped metrics such as Purchase revenue and Ecommerce purchases.
| Metric | What it means | Watch out for |
|---|---|---|
| Items viewed | Items viewed (view_item events with an items array) | |
| Items added to cart | Items added to a cart | |
| Items purchased | Units of each item included in purchase events | |
| Item revenue | Price × quantity − refunds | Excludes tax and shipping, so it’s usually lower than Purchase revenue |
| Item discount amount | Item discount × quantity | How coupons and sales are working |
You can see product-level numbers in the Ecommerce purchases report under Drive sales. How to read it is covered in How to Use Google Analytics 4 for Ecommerce.
Advertising metrics
| Metric | What it means | Watch out for |
|---|---|---|
| Google Ads cost | Amount spent on Google Ads | Shows up once Google Ads is linked |
| Google Ads clicks, Google Ads impressions | Clicks on and impressions of your Google Ads | |
| Google Ads cost per click | Average cost per click | |
| Non-Google cost, Non-Google cost per click, and similar | Cost and clicks for other ad platforms, such as Meta | Only when you import cost data |
| Days to key event, Touchpoints to key event | Days from the ad interaction to the key event, and how many ad interactions it took | Found in the Attribution section of Advertising |
Ad platforms and GA4 count differently, so their numbers won’t match. See our attribution guide for why.
Lifetime metrics
| Metric | What it means | Watch out for |
|---|---|---|
| LTV | Total purchase revenue from a user since their first visit | Use a user lifetime exploration in Explore |
| Lifetime transactions | Completed purchases by a user since their first visit | |
| Lifetime sessions, Lifetime engagement duration | Sessions since the first visit, and total engagement time |
Lifetime metrics don’t appear in standard reports. You use them in a user lifetime exploration, for example to compare LTV by the source that first brought each user in. For how to use Explorations, see our guide to GA4 Explorations.
Which metric answers which question
Choosing by question is easier than starting from metric names.
| What you want to know | Metric to use |
|---|---|
| How many people came | Active users |
| Whether new customers are coming | New users, First time purchasers |
| How many visits | Sessions |
| Whether visitors actually looked | Engagement rate, Average engagement time |
| Whether it led to outcomes | Key events, Session key event rate |
| How much sold | Purchase revenue |
| How much each order was worth | Average purchase revenue |
| Which products stall, and where | Items viewed, Items added to cart, Items purchased |
| Whether ads paid off | Google Ads cost, Purchase revenue (see also our ROAS guide) |
| Which sources bring in long-term customers | LTV (user lifetime exploration) |
Ecommerce revenue breaks down into metrics
An online store’s revenue can be written as three metrics multiplied together:
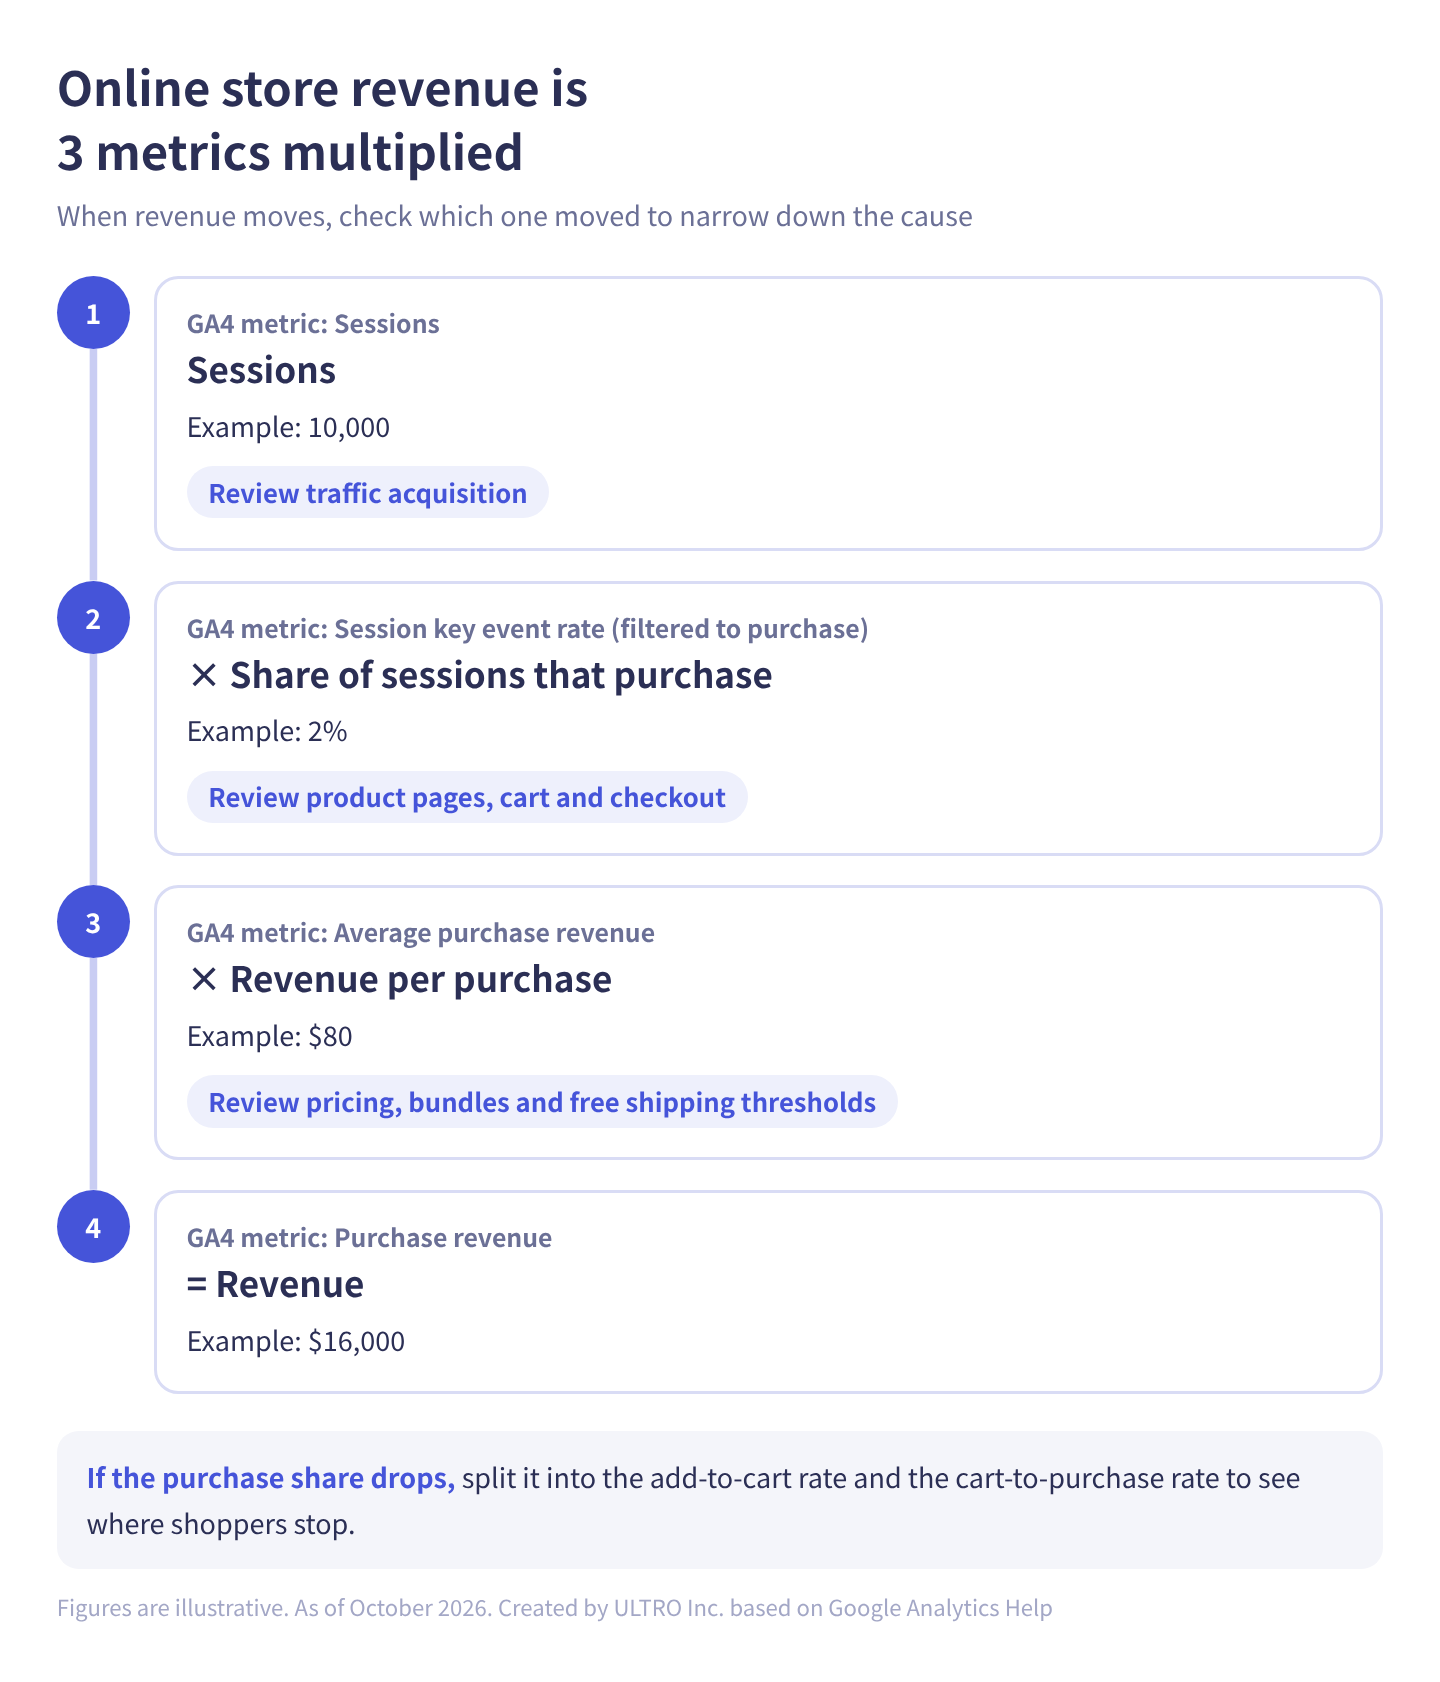
Broken out:
| Component | GA4 metric | What to review when it moves |
|---|---|---|
| Sessions | Sessions | Traffic from ads, search, social and email |
| Share of sessions that purchase | Session key event rate (narrowed to purchase) | Product pages, cart and checkout |
| Revenue per purchase | Average purchase revenue | Pricing, bundles and free shipping thresholds |
For example, 10,000 sessions with 2% purchasing at $80 per purchase comes to $16,000 in revenue (illustrative numbers). When revenue drops, find which of the three dropped and you’ll know whether to look at traffic, the site itself or order value. For more on the purchase share, see our ecommerce conversion rate guide.
Here’s how we take it further. When the purchase share drops, we split it further into Items added to cart ÷ Items viewed and Items purchased ÷ Items added to cart, to see whether shoppers stall on product pages or in the cart. To see exactly which step they drop off at, use a funnel exploration in Explore.
Once it’s split, pick one component to move. Trying to nudge all three up a little at a time rarely works. Separate what your team can actually change from what it can’t, and choose one of the things you can change. In our experience, it usually pays to raise the purchase share first and then grow sessions with ads, because every extra paid session is then worth more.
What to know when the numbers don’t match
The same metric can go by different names
Some metrics are labeled differently depending on where you look (as of October 2026):
| Where you see it | Also called |
|---|---|
| Users (in reports) | Active users |
| Average engagement time per active user (in reports) | Average engagement time (help center) |
| Key events | Conversions (before March 2024) |
| Views | Pageviews (Universal Analytics) |
The calculation is the same. That’s why articles online often seem to use different names for the same thing.
Fields with different scopes may not combine
If Purchase revenue and Item revenue don’t match, or you can’t put Item name next to Purchase revenue, scope is the reason. See our GA4 custom dimensions guide for how scopes work.
Users and sessions are estimates
Active users and sessions in GA4 reports aren’t exact counts; they’re estimated with a method called HyperLogLog++. That’s why daily numbers added up don’t match the number for the whole period. For details, see our guide to GA4 users and sessions.
Explorations can be sampled
When an exploration covers a lot of data, GA4 may apply sampling, estimating the whole from part of the data. When there are too many rows, some get grouped into “(other).”
Shopify defines things differently
Shopify’s sessions and visitors and GA4’s sessions and users are counted by different systems, so they won’t match. Comparing GA4 against itself, such as week over week, is more useful.
Purchase counts are also often lower in GA4. Purchases where the tag didn’t run in the browser, and orders that never go through a browser, such as POS orders or repeat subscription orders, don’t reach GA4. To reconcile them order by order, see GA4 Not Tracking All Shopify Purchases? We built a Shopify app for the browser-side gap, GapFill. It’s our own product, so read with that in mind. It recovers missing GA4 purchase events server-side, works alongside your existing tags, and the missing purchases report is free.
Our Shopify appGapFill: Recover missing GA4 purchase events server-sideWorks alongside your existing tags. Free missing purchases report.See GapFill →Sources
- [GA4] Analytics dimensions and metrics (Google Analytics Help)
- [GA4] Understand user metrics (Google Analytics Help)
- [GA4] About Analytics sessions (Google Analytics Help)
- [GA4] Engagement rate and bounce rate (Google Analytics Help)
- [GA4] Mark events as key events (Google Analytics Help)
- [GA4] Ecommerce purchases report (Google Analytics Help)
- [GA4] Comparing metrics: Google Analytics vs. Universal Analytics (Google Analytics Help)
- HyperLogLog++: Google Analytics’ unique count approximation (Google for Developers)
- API dimensions and metrics (Google for Developers)
FAQ
What's the difference between metrics and dimensions in GA4?
Dimensions are how you split the data: channel, page, item name, device and so on. Metrics are what you count: sessions, users, revenue and so on. In a report table, the left column is the dimension and the number columns to the right are metrics.
What does "Users" mean in GA4 reports?
Active users: people who had an engaged session or visited for the first time. It's a different metric from Total users, which counts everyone who logged at least one event.
Should I look at Total revenue or Purchase revenue?
For ecommerce sales, use Purchase revenue. Total revenue adds ad revenue on top of purchases, in-app purchases and subscriptions. For a web store with no ad revenue, the two come out almost the same.
What's the difference between Transactions and Ecommerce purchases?
Google defines Ecommerce purchases as the number of times users completed a purchase, and Transactions as the number of completed purchases on your site. Both are populated by the purchase event, and for a web store they're nearly the same.
Why is Item revenue lower than Purchase revenue?
Item revenue is price × quantity minus refunds, and excludes tax and shipping. Purchase revenue uses the purchase event's value, which often includes them, depending on how your tag sends value.
- Google's help center lists about 140 GA4 metrics
- Read them in 8 groups: users, sessions, engagement, views and events, key events, ecommerce, advertising and lifetime
- "Users" in reports means Active users, not Total users
- Ecommerce revenue breaks down into sessions × share of sessions that purchase × revenue per purchase
- Some metrics go by different names in reports, in the help center and in Universal Analytics
- Metrics and dimensions have scopes (user, session, event, item), and some combinations of different scopes aren't allowed
Written byRyushi Nagata
CEO, ULTRO Inc. (Tokyo)Shopify Partner. Ryushi handles Shopify store builds, maintenance, advertising and CRM end to end, and has managed more than ¥4 billion in ad spend over his career. He holds Google Ads certifications (Search, Display, Video, Shopping, Apps, Performance Max, Measurement) and the Google Analytics certification.
How many purchases is GA4 missing in your store?
GapFill matches your Shopify orders against GA4 purchases, shows what GA4 missed, and recovers those purchase events server-side. It works alongside your existing tags, and the missing purchases report is free.